Volume-Weighted Fibonacci PivotThis indicator automatically plots dynamic Fibonacci retracement and extension levels based on a volume-weighted pivot point within a user-defined lookback period or date range. It intelligently calculates a central "pivot" price biased toward high-volume bars, then draws symmetric levels both upward (extensions) and downward (retracements) for balanced confluence analysis.
How It Works (Technical Methodology)
Lookback Period Determination
Multiple filter modes control the data range used for calculations:
"Last X Bars": Fixed number of recent bars (default 400, max 4999).
"Manual Date": User-specified start date.
"Interactive (Chart)": Confirmed start date via input.
"None": Full available history (falls back to max bars).
Optionally, when using "Last X Bars", calculations can pull data from a higher/lower user-selected timeframe via request.security() for multi-timeframe alignment.
A dotted vertical line marks the start point in date-based modes.
Range and Pivot Calculation
Within the selected period:
Highest high and lowest low define the full price range.
Average volume is computed across the period.
Volume-Weighted Pivot: Average close price only from bars where volume > average volume (fallback to simple midpoint if no high-volume bars).
This creates a "smart" central pivot that leans toward areas of greater participation, often aligning with institutional activity.
Fibonacci Level Generation
User-configurable ratios (default: 0.236, 0.382, 0.5, 0.618, 0.786, 1.0, 1.272, 1.414, 1.618).
Levels are calculated symmetrically around the volume-weighted pivot:
Upward: Pivot + (Range × Ratio × Correction Factor) – teal/cyan shades.
Downward: Pivot - (Range × Ratio × Correction Factor) – red shades.
Correction Factor (default 0.5): Scales level spacing for tighter/wider grids without altering ratios.
Only the user-defined number of active lines (default 9) are drawn.
Visual Construction
Central Pivot Line: Thick yellow horizontal line with label showing exact price.
Up/Down Levels: Dashed lines extended into the future, labeled with ratio direction ("Up" or "Dn").
All objects redraw only on the last bar for performance, clearing previous drawings.
Multi-Timeframe Option
When enabled with "Last X Bars":
Pulls high/low/volume data from specified timeframe.
Aligns the pivot and levels to higher-timeframe structure while displaying on current chart – ideal for intraday traders seeking HTF confluence.
How to Use
This tool provides clean, volume-aware Fibonacci grids for identifying potential support/resistance, reversal zones, and targets.
Volume-Weighted Pivot: Often acts as a strong mean reversion level or fair value area.
Upward Levels (Teal): Potential resistance/extensions in bullish moves; watch for reactions on retests.
Downward Levels (Red): Potential support/retracements in bearish moves.
Confluence: High probability when price reacts at levels aligning with other tools (order blocks, pivots, volume profile).
Correction Factor: Lower values (<0.5) for tighter grids in ranging markets; higher (>0.5) for trending markets.
Multi-Timeframe Mode: Use on lower charts (e.g., 15m) with HTF input (e.g., 4H or Daily) to project major structure levels.
Common Setups:
Pullbacks to 0.618–0.786 zones for continuation entries.
Breaks beyond 1.0–1.618 for extension targets.
Reactions near pivot line for mean reversion trades.
Adjust ratios and active line count to match your preferred Fibonacci style (classic retracement vs. extensions).
Disclaimer
This indicator is a technical analysis tool and should be used in conjunction with other forms of analysis. Past performance does not guarantee future results. Always use proper risk management.
Cari skrip untuk "volume profile"

Gold Asia Session Highlighter [IST]Here is a polished description and guide for your Gold Asia Session Highlighter. You can use this text for a YouTube description, a Telegram post, or a PDF guide to explain the tool to others.
Gold Asia Session Highlighter (IST) | Visual Indicator
This is a custom TradingView indicator designed to simplify the Gold Asia Strategy. Instead of automating trades, this tool purely handles the visuals. It automatically highlights the correct Asia Session time window (adjusting for Winter/Summer hours) and marks the exact points where you should draw your Fixed Range Volume Profile (FRVP) tool.
Perfect for: Traders who prefer to draw their own FRVP levels manually but want to ensure they are using the exact, error-free time range every single day.
Features
✅ Automatic Time Zone: Strictly calculated using IST (Indian Standard Time), so you don't need to convert time zones manually.
✅ Smart Season Detection: Automatically switches between Winter Session (04:30 – 06:25) and Summer Session (03:30 – 05:25) based on the current month.
✅ Visual Guidance: Highlights the session background and places "START" and "END" labels on the exact candles.
✅ Zero Clutter: Clean visuals with no moving averages or strategy lines—just the session box.
How to Use It
Add to Chart: Apply the script to your Gold (XAUUSD) 5-minute chart. You will see a blue highlighted box appear during the Asia session.
Locate the Labels:
Look for the blue START label (bottom of the candle).
Look for the red END label (top of the candle).
Draw Your FRVP:
Select the Fixed Range Volume Profile tool from your TradingView toolbar.
Click exactly on the START candle.
Drag and release exactly on the END candle.
Trade: You now have the exact Value Area High (VAH), Value Area Low (VAL), and Point of Control (POC) for the day. Use your breakout strategy as usual!

Smart Money Flow - Institutional OI & Volume Analyzer [Pro]# 🎯 Nifty Smart Money Flow - Institutional OI & Volume Analyzer
## What It Does
Professional-grade indicator that tracks **Open Interest (OI) cycles, volume footprints, and basis analysis** across Nifty 50's top 10 heavyweight stocks (representing ~54% of index weight). Identifies institutional accumulation/distribution using **4-quadrant OI analysis** combined with volume surge detection and ATR-based regime filtering.
## 🔥 Key Features
### Institutional-Grade Analytics
- **OI Cycle Detection**: Identifies Long Buildup (LB), Short Covering (SC), Short Buildup (SB), and Long Unwinding (LU) for top 10 Nifty constituents
- **Volume Validation Layer**: Detects institutional footprints via volume spikes >150-200% of 20-period MA
- **Cost of Carry Analysis**: Real-time basis tracking between spot and futures prices
- **Signal Quality Score (0-100)**: 4-component scoring system measuring alignment strength, weighted momentum, trend purity, and basis confirmation
### Advanced Regime Detection
- **Percent-Based ATR Filter**: Normalized volatility comparison prevents false signals across different price levels
- **Consecutive Bar Confirmation**: Requires 3+ bars of sustained signal before regime classification
- **Dynamic Strategy Recommendations**: Suggests optimal option structures (Call/Put Spreads, Iron Condor, Straddle) based on market regime
### Smart Money Divergence Alerts
- **Top Stock Divergence Detection**: Warns when heavyweight stocks (HDFC, Reliance, ICICI) contradict index signal
- **Pareto Principle Application**: Weights top 3 stocks (~30% index weight) for maximum predictive accuracy
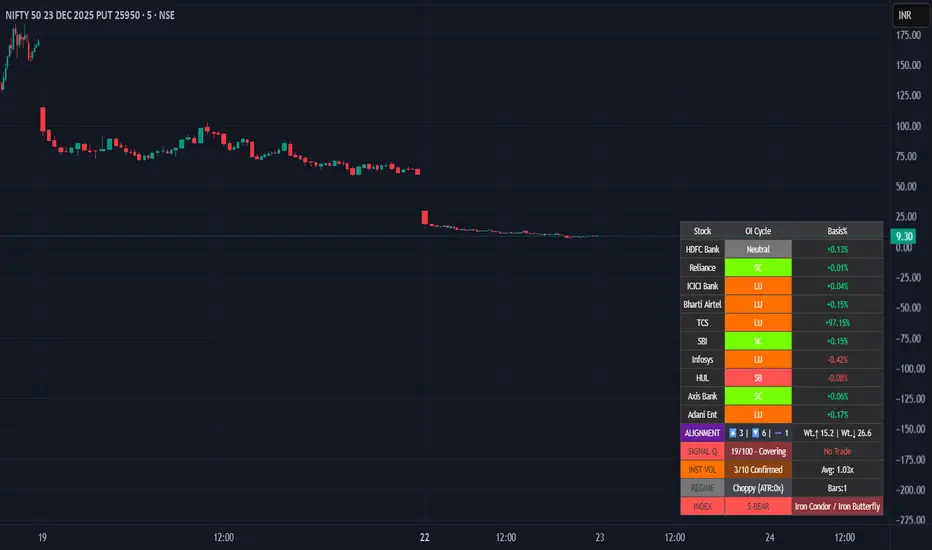
## 📊 Visual Dashboard
Clean, dark-theme optimized table displaying:
- Individual stock OI cycles with color coding
- Basis/premium percentages for each heavyweight
- Alignment metrics (Bullish/Bearish/Neutral count)
- Quality score with position sizing guidance (Full Size/Spreads Only/No Trade)
- Institutional volume confirmation count
- Real-time regime status with ATR ratio
## 💡 How To Use
### For Intraday Traders (1m-15m)
1. Enable "Institutional Volume Filter" for noise reduction
2. Wait for Quality Score ≥60 for directional trades
3. Use regime-based structure recommendations (displayed in INDEX row)
### For Swing/Positional Traders (1H-Daily)
1. Focus on consecutive bar count ≥3 for trend confirmation
2. Check for divergence warnings before major positions
3. Use basis analysis to time entries (premium = bullish sentiment)
### For Options Traders
1. **Quality Score 60-100**: Full size directional (Buy Calls/Puts)
2. **Quality Score 30-60**: Spreads only (Call Spread/Put Spread)
3. **Quality Score 0-30**: Avoid directional; use Iron Condor in choppy regime
## ⚙️ Customization Options
- **10 Toggle Switches**: Show/hide individual stocks for cleaner dashboard
- **Volume Threshold**: Adjust institutional detection sensitivity (default 1.5x)
- **Regime ATR Length**: Fine-tune volatility measurement period (default 14)
- **Alignment Thresholds**: Set minimum bullish/bearish stock count for signals (default 5/10)
## 📈 Best For
- Nifty 50 Index traders (Futures & Options)
- Bank Nifty analysis (3 major banks included)
- Institutional flow tracking
- Multi-stock correlation analysis
- Regime-based strategy adaptation
## 🚨 Alerts Included
✅ Strong Bullish Signal (7+ stocks aligned + volume confirmation)
✅ Strong Bearish Signal (7+ stocks aligned + volume confirmation)
✅ Divergence Warning (Top stocks contradict index move)
✅ Institutional Volume Surge (7+ stocks with volume spikes)
## 📚 Technical Foundation
Based on institutional trading principles:
- **Order Flow Analysis**: Price + OI correlation for position identification
- **Smart Money Concepts**: Volume profile + basis analysis for institutional tracking
- **Regime Filtering**: Adaptive strategy selection based on volatility environment
- **Weighted Aggregation**: Pareto principle ensures top stocks drive signal quality
## 🔧 Version History
- v6.0: Initial release with 10-stock coverage
- Optimized request.security() calls: 30 total (3 per stock)
- Dynamic table rendering with barstate.islast efficiency
## 📌 Important Notes
- **Data Source**: NSE India (Spot + Futures + OI)
- **Update Frequency**: Real-time (dependent on chart timeframe)
- **Best Timeframes**: 5m, 15m, 1H, Daily
- **Avoid**: Pre-market hours (OI data may be stale)
---
**Category**: Volume / Order Flow
**Market**: NSE India - Nifty 50
**Timeframe**: Multi-timeframe (1m to Daily)
**Complexity**: Advanced (suitable for intermediate to professional traders)
## Tags (for SEO)
#nifty50 #orderflow #openinterest #institutional #smartmoney #volume #regime #niftyfutures #niftyoptions #oi #banknifty #heavyweights #basis #costofcarry #divergence #qualityscore #nseindia #optionstrading #algorithmic #quantitative
MTF Key Levels Pro [Confluence & Flow]MTF Key Levels Pro is an all-in-one market structure and context toolkit designed to reduce chart noise and surface the price levels that matter most. It combines multi-timeframe trend alignment, institutional-style reference levels (VWAP anchors, pivots, volume POC, prior day levels), and confluence detection so you can quickly identify where price is likely to react—and whether the broader flow supports continuation or reversal.
This script is intentionally modular: you can enable only what you trade (scalping, day trading, swing, position) while keeping the chart readable via selective plotting and a compact MTF dashboard.
What It Does
1) Key Levels Engine (Core Map)
The indicator plots a “key-level stack” from multiple methodologies so you are not relying on a single lens:
Volume Profile POC (Point of Control) over a configurable lookback (highest traded activity zone).
Daily Pivot Levels calculated from prior day H/L/C (PP, R1, S1 and extended levels in the logic).
Fibonacci Retracements from recent swing range (38.2 / 50 / 61.8).
Moving Averages (three configurable MAs for trend structure).
Previous Day High/Low (PDH/PDL) for intraday reference points.
ATH/ATL tracking (optional) for macro context.
2) Anchored VWAP Suite (Flow Anchors)
A multi-anchor VWAP system that resets and recalculates at the start of each period:
Hourly VWAP (scalping / micro-structure)
Daily VWAP (day trading standard reference)
Weekly VWAP (swing context)
Monthly VWAP (position context)
3) Multi-Timeframe Alignment Dashboard (Trend Consensus)
The dashboard pulls 5 configurable timeframes (defaults: 5m, 30m, 1h, 4h, D) and displays:
Price snapshot per timeframe
Trend direction (simple momentum/trend comparison vs lookback)
Volume
% change
Alignment status (BULL ALIGNED / BEAR ALIGNED / MIXED), including bars since alignment began
Use this to avoid trading against higher timeframe pressure and to time entries when multiple timeframes agree.
4) Order-Flow Lite (Volume & Delta)
A practical “flow confirmation” layer using candle-based volume classification:
Buy vs sell volume approximation (close vs open)
Delta strength label (Strong Buy / Strong Sell / Neutral)
Volume surge detection vs SMA(volume) with a configurable multiplier
Optional background shading on surge events
5) Confluence Zones (Signal Compression)
Confluence zones automatically form when multiple independent levels cluster together within a configurable tolerance:
You choose tolerance % and minimum levels required (e.g., 3+).
Zones are plotted as highlighted regions and listed in the dashboard with proximity markers (AT / NEAR).
This is the “decision layer”: the script doesn’t just draw levels—it tells you where multiple reasons to react overlap.
How to Use It (Practical Outline)
Typical Workflow
Check dashboard alignment: trade with alignment for continuation setups; treat MIXED as caution/mean-reversion regime.
Identify nearest confluence zones: prioritize trades at/near zones versus isolated single levels.
Use VWAP anchor + PDH/PDL + Pivot as the intraday framework, then confirm with volume surge/delta bias.
Manage risk around zones: zones are natural areas for rejection, breakout, or retest logic.
Recommended Configurations (Quick Start)
Scalping (1m–5m chart): Hourly VWAP + Daily VWAP + Daily Pivots + Confluence
Day Trading (5m–1h): Daily VWAP + Pivots + PDH/PDL + Confluence + Alignment dashboard
Swing (1h–4h): Weekly VWAP + MA50/MA200 + Confluence + Alignment
Position (D/W): Monthly VWAP + MA200 + ATH/ATL + Confluence
Alerts Included
Confluence Touch: triggers when price is within proximity of a confluence zone.
Trend Change: triggers when the alignment state changes (e.g., MIXED → BULL ALIGNED).
Volume Spike: triggers on surge events versus the configured baseline.
Notes / Intended Use
This indicator is built for context and decision support (key levels + trend consensus + flow cues). It is not a standalone “buy/sell system” by design; instead, it provides a structured map for entries, invalidation, and target planning around areas of highest market agreement.
If you want, I can also produce a TradingView-ready “Description + Feature bullets + How to trade + Settings guide + Alert guide” in the exact formatting style commonly used on public TradingView scripts (including a short disclaimer and a clean feature list).

NY Session Vol Entries (RB Trading)NY Session Vol Entries (RB Trading)
NY Session Vol Entries is an intraday analysis script designed to evaluate price behavior during U.S. market hours on the one hour chart. It focuses on the interaction between relative volume expansion, adaptive volatility structure, and directional momentum alignment to help users interpret active market conditions.
The script is intended specifically for liquid U.S. equities during the New York session and is not designed for use outside this context.
Intended Usage and Scope
• Timeframe: 1 hour only
• Market hours: New York session
• Asset class: U.S. equities with consistent volume
• Style: Intraday structure and momentum evaluation
• Alerts: Available for all signal types
Core Framework
The script evaluates market behavior through three interdependent components that must align before a setup is displayed:
Relative volume behavior
Volatility expansion and contraction
Directional momentum context
This structure helps filter low-participation periods and reduce noise.
Relative Volume Analysis
The script compares current volume to a rolling 14-period average to identify periods where participation meaningfully deviates from typical conditions.
Elevated volume often occurs during session opens or active repricing phases. When volume remains muted, the script suppresses signals to avoid low-quality environments.
Adaptive Volatility Structure
Volatility bands are calculated using an 8-period true range measurement. These bands adjust dynamically based on recent volatility rather than remaining static.
During elevated participation, the bands compress to reflect tighter price acceptance. As volatility expands, the bands trail price to help visualize directional structure.
Directional Momentum Context
Directional context is determined using a dual moving average relationship.
• When short-term momentum is above longer-term momentum, the script allows only bullish evaluations
• When short-term momentum is below longer-term momentum, the script allows only bearish evaluations
This alignment reduces counter-directional signals and helps maintain structural consistency. The filter can be disabled if users wish to study range behavior.
Signal Classification
The script displays two types of informational labels:
Volume-Aligned Signals
These appear only when directional momentum and relative volume expansion align at candle close.
Momentum Rotation Signals
These indicate directional shifts regardless of volume and are intended to provide context rather than standalone triggers.
All signals are confirmed only after the candle closes. No intrabar logic is used.
Stop and Target Reference Plotting
When conditions align, the script plots visual reference levels:
• A stop reference positioned beyond the momentum structure
• A projected target reference calculated using a fixed 2R multiple relative to the stop distance
These levels are provided for consistency and planning. They are not forecasts or guarantees.
Session and Timing Considerations
The script is designed specifically for New York market hours. Liquidity and participation outside this window often distort volume and volatility behavior.
Earnings sessions should be treated with caution, as event-driven price action can override normal structural behavior.
Opening Range Consideration
The first one hour candle of the New York session can display elevated volatility due to initial repricing. Allowing additional candles to form may provide clearer structural information before evaluating signals.
Why One Hour and New York Session
The one hour timeframe balances structure and responsiveness while reducing lower-timeframe noise. New York trading hours provide the most reliable volume profile for U.S. equities, making relative volume analysis more meaningful.
Settings Overview
• Volatility period: 8
• Volatility multiplier: 3.0
• Volume average period: 14
• Momentum averages: 8 and 21
• Trend filter: Enabled by default
• Alerts available for all signal types
Chart Usage Guidelines
• Use the script on a clean chart
• Avoid stacking additional momentum or volume indicators
• Drawings should only be used when they help interpret structure
Important Notes
This script analyzes historical price and volume behavior. It does not predict future price movement or ensure outcomes. Users should test the tool, understand its logic, and apply independent risk management.

XAUMO MegaBar VSA by Mohamed Mahmoud XAUMO MegaBar VSA — Smart Money Breakout & Reversal Engine for XAUUSD
(Educational Use Only)
1) WHAT THIS INDICATOR DOES
XAUMO MegaBar VSA is an institutional-style smart money engine for XAUUSD designed to show you what professional money is doing, not just where price is moving.
It combines:
- MegaBar detection on 1H and 15m
- VSA (Volume Spread Analysis) events
- VPOC / WVPOC and volume clusters
- Liquidity sweeps, CHoCH, order blocks, FVGs
- Full Fibonacci leg mapping (retracements + extensions)
- Pre-built execution ladders (Entry, SL, TP1–TP4, Reverse Fib trades)
All in one dashboard with:
- Color-coded candles
- Clean, ATR-offset labels
- Optional tables and debug panels
So traders can quickly decide:
“Is this move driven by smart money, or is it just noise?”
2) CORE MODULES & FEATURES
A) SESSION + ACCUMULATION / DISTRIBUTION CONTEXT
- Session filter: London, New York, Overlap, or custom.
- Accumulation / distribution zones shaded on chart with adjustable colors/opacity.
- Quick legend so you always know if the market is in “smart money accumulation” or “distribution”.
HOW TRADERS USE IT:
Focus only on your trading session and instantly see if volume is building (accumulation), unloading (distribution), or flat. This helps you avoid trading in dead liquidity.
--------------------------------------------------
B) MEGABAR ENGINE + FIB MAP
- Automatically detects “MegaBars” (institutional candles) on 15m and 1H.
- Uses body size, range, and volume to pick only meaningful bars.
- Builds a full Fibonacci map from each active MegaBar:
• Retracements: 0, 13, 23.6, 38.2, 50, 61.8, 78.6, 86.2, 100, and -33.
• Extensions: 125% up to 600%+ (configurable ladder).
- Per-level style controls:
• Color, width, line style (solid/dotted/dashed).
• Optional price labels with ATR-based offsets.
- Main Fib legend that explains shallow / normal / deep reload zones.
HOW TRADERS USE IT:
You stop guessing where to buy or sell. You trade around the institutional leg:
- Buy dips into defined reload zones after bullish MegaBars.
- Sell rallies into extension zones after bearish MegaBars.
- Use clean, pre-mapped structure for both scalps and swings.
--------------------------------------------------
C) VSA ENGINE + CANDLE LABELING
- Detects a full set of VSA events such as:
• No Demand / No Supply
• Stopping Volume
• Absorption
• Springs / Upthrusts
• Buying Climax / Selling Climax
• Bullish / Bearish EVR
• Tests and confirmed VSA signals at S/R
- Enhances with:
• Body vs total range analysis
• Wick dominance for exhaustion vs aggression
• Momentum and volume confirmation filters
HOW TRADERS USE IT:
Each label becomes a “comment” from smart money on the chart:
- “No Demand” near resistance + weak RVOL = skip long entries.
- “Stopping Volume” + spring at Fib reload zone + VPOC cluster = potential high-quality long.
- Combine VSA with the MegaBar Fib map and volume profile for structured decisions.
--------------------------------------------------
D) SUPERSONIC BREAKOUT ENGINE
- Calculates a breakout strength score using:
• RVOL and volume expansion
• Spread expansion vs recent bars
• Body quality (body vs range)
• Bar progress (how much of the candle’s time has elapsed)
- Differentiates:
• Potential vs confirmed breakouts
• Strong, volume-backed moves vs weak spikes
- Optional debug label explaining:
• Momentum score
• Volume ratio and RVOL
• Spread behaviour
• Body quality
• Bar elapsed %
HOW TRADERS USE IT:
You avoid chasing every big candle.
You only act when:
- Breakout strength is high,
- Volume confirms the move,
- Structure (Fib / VPOC / CHoCH) is aligned.
--------------------------------------------------
E) VPOC / WVPOC CLUSTERS & DYNAMIC ZONES
- Tracks real-time VPOC and WVPOC.
- Identifies VPOC/WVPOC clusters as powerful S/R zones.
- Confirms bullish or bearish breaks when price clears these levels with volume.
- Provides dynamic SL and TP logic:
• SL near/behind VPOC with ATR buffer.
• TP ladders aligned with volume structure.
HOW TRADERS USE IT:
You anchor your risk to where the most volume traded, not random price points:
- Use VPOC as a rational stop placement.
- Treat VPOC/WVPOC clusters as “coiled springs” – zones where large moves often start.
--------------------------------------------------
F) SMART MONEY ENTRY ENGINE (1H + 15M MEGABARS)
- Uses MTF `request.security` logic to bring 1H MegaBars into lower timeframes.
- Identifies:
• 1H + 15m confluence entries (A-grade setups).
• Single-TF entries (B-grade setups).
- Pre-calculates for each scenario:
• Entry level (Fib-based within the MegaBar range).
• Stop loss (beyond range or leg-based).
• TP1–TP4 along Fib extensions / structure.
- Labels show:
• “Entry = …”
• “SL = …”
• “TP1 = … / TP2 = … / TP3 = … / TP4 = …”
with adjustable font size and ATR-based offsets.
- Optional “show only latest” mode to keep your chart clean.
- Alert-ready so you can receive notifications when conditions are met.
HOW TRADERS USE IT:
You get a fully defined execution ladder:
- The engine tells you where a logical entry is,
- Where a logical SL should be,
- And how to scale out with multiple targets.
You can use:
- Confluence setups for main trades,
- Single-TF setups for more frequent but lower conviction trades.
--------------------------------------------------
G) REVERSE FIB TRADING MODULE
- Triggers after extended moves when key TPs are hit.
- Looks for:
• Rejection candles at or beyond major extensions.
• Exhaustion + VSA confirmation.
- Builds a reverse (counter-trend) Fib plan:
• Counter-trend entry from extension extremes.
• TP ladder based on 0.618, 0.786, 1.236, 1.382, 1.5, 1.618, 2.0, etc.
• SL and TSL based on ATR and Fib distance.
- ATR timeframe adapts to chart timeframe.
HOW TRADERS USE IT:
You can fade overextended moves once structure and P/A agree:
- Trend traders can use it to tighten or exit.
- Counter-trend traders can structure “fade” setups with defined risk.
--------------------------------------------------
H) LIQUIDITY SWEEPS, CHoCH, ORDER BLOCKS, FVGs
- Detects sweeps above highs and below lows (liquidity grabs).
- Marks CHoCH (Change of Character) when structure flips with volume.
- Basic smart money order block detection (bullish / bearish).
- FVGs (Fair Value Gaps) shaded on chart, removed when filled.
HOW TRADERS USE IT:
Combine sweeps + CHoCH + MegaBar + VSA + VPOC:
- Join clean, volume-backed continuations.
- Fade obvious stop hunts when they reject into strong zones.
--------------------------------------------------
I) VSA + BREAKOUT DASHBOARD TABLE (OPTIONAL)
- Compact table with:
• VSA context
• Breakout score
• RVOL / volume status
• Spread and candle quality
• ATR regime
• Close position within the bar
• VPOC and elapsed bar percentage
HOW TRADERS USE IT:
Before pressing the button, glance at the table:
- Is volatility supportive?
- Is volume confirming?
- Is this a clean breakout or a tired move?
This pushes you toward rule-based execution and away from impulse.
--------------------------------------------------
3) TYPICAL TRADING WORKFLOW WITH XAUMO MEGABAR VSA
A) Pick timeframe and session
- Use 15m or 1H on XAUUSD.
- Align the indicator’s session inputs with your actual trading hours.
B) Read context first
- Check accumulation / distribution zones.
- Look at VSA events and the breakout engine.
- Note where VPOC / WVPOC are relative to price.
C) Find the active MegaBar and its Fib structure
- Identify the most recent bull/bear MegaBar.
- See if price is:
• Pulling back into reload zones,
• Breaking out of them,
• Or extending into high-risk zones.
D) Wait for smart money confirmation
- Look for:
• Confluence setups (1H + 15m MegaBars),
• Strong breakout score,
• Valid VSA signals,
• Helpful structure: CHoCH, FVG, sweeps.
E) Execute using the printed ladders
- Use the on-chart Entry / SL / TP labels as your execution framework.
- Adjust lot size and risk % according to your own plan.
F) Manage and exit
- Use ATR / VPOC logic to trail or lock profits.
- Rotate to reverse Fib setups if extensions look exhausted.
4) WHO THIS INDICATOR IS FOR
- Gold traders (XAUUSD CFD or spot) on 15m and 1H.
- Traders who prefer institutional structure (volume, VPOC, SMC, Fib) over simple indicators.
- Traders who want pre-structured entries, SL, and TP ladders without losing flexibility.
- Advanced students of VSA and smart money concepts who want everything in one tool.
5) FULL EDUCATIONAL DISCLAIMER (READ CAREFULLY)
- This indicator and all descriptions are for EDUCATIONAL PURPOSES ONLY.
- NOTHING in this script, its labels, tables, alerts, outputs, or documentation is:
• Investment advice
• Trading advice
• A recommendation to buy or sell any asset
• A signal service or portfolio management tool
- Markets are risky. Trading leveraged instruments such as CFDs, futures, or margin products involves a HIGH RISK of loss, including the possible loss of ALL invested capital.
- Past performance, backtests, or hypothetical examples DO NOT guarantee future results.
- Any probabilities, scores, or “quality levels” shown by the indicator are purely algorithmic and DO NOT represent guarantees or promises of profit.
- You are solely responsible for:
• Your position sizing
• Your leverage
• Your entries, exits, and risk management
• Compliance with local regulations and tax rules
- Before trading live with real money, you should:
• Thoroughly backtest and forward-test the indicator.
• Use a demo account to understand how signals behave in real time.
• Consult a licensed financial professional if you need personalised investment or trading advice.
- By using this indicator:
• You accept that the author and any associated entities or brands (including XAUMO, XAUMO indicators, and any promotional text) bear NO LIABILITY for any financial losses, missed gains, or decisions you make based on this tool.
• You agree that you are acting entirely at your own risk and that all outputs are informational and educational, not prescriptive trading instructions.
In short:
Use XAUMO MegaBar VSA as a powerful educational and analytical companion,
NOT as a substitute for your own independent judgment, testing, and risk control.
=====================================================
XAUMO MegaBar VSA — محرّك البريك آوت و الريفرسال بتاع السمارت ماني للدهب
( استخدام تعليمي بس)
1) المؤشّر ده بيعمل إيه؟
XAUMO MegaBar VSA معمول مخصوص للـ XAUUSD عشان يورّيك "الفلوس الكبيرة" بتتحرك إزاي،
مش بس السِعر رايح فين.
بيجمع في حتّة واحدة:
- رصد MegaBar على الساعة والربع ساعة
- VSA (Volume Spread Analysis) – سلوك الفوليوم جوّه الشمعة
- VPOC / WVPOC و تجمّعات الفوليوم المهمّة
- سويپس لليكويديتي + CHoCH + Order Blocks + FVGs
- خريطة فيبوناتشي كاملة (Retrace + Extensions)
- سلالم تنفيذ جاهزة (Entry, SL, TP1–TP4 + صفقات Reverse Fib)
وكل ده:
- بألوان واضحة على الشموع
- لِيبلات متظبّطة بـ ATR Offset
- Tables و Panels اختيارية
عشان المتداول يسأل نفسه:
"الحركة دي بتاعة سمارت ماني؟ ولا مجرد دوشة ملوش لازمة؟"
2) أهم الموديولات اللي جوّه المؤشّر
A) الكونتكست بتاع السيشن + تجميع/توزيع
- فلتر جلسات: لندن – نيو يورك – overlap – أو وقت تحطّه انت.
- مناطق Accumulation / Distribution متظلّلة بألوان أنت بتختارها.
- لچند بسيط يوضّح لك السوق دلوقتي: تجميع؟ توزيع؟ ولا نايم.
المتداول يستخدمه إزاي؟
تركّز بس في الجلسة اللي انت شغّال فيها، وتشوف فورًا:
فيه بناء مراكز؟ فيه تصريف؟ ولا مفيش فوليوم أصلاً؟
ده يقلّل دخولك في أوقات السوق فيها “ميت”.
--------------------------------------------
B) محرّك الـ MegaBar + خريطة الفيبوناتشي
- المؤشّر يلقط لوحده الـ MegaBars (شموع مؤسّسات) على 15m و 1h.
- بيعتمد على: حجم الجسم، مدى الشمعة، الفوليوم.
- يرسم خريطة فيبوناتشي كاملة من الرجل الأساسية:
• Retrace: 0, 13, 23.6, 38.2, 50, 61.8, 78.6, 86.2, 100, -33
• Extensions: من 125% لحد 600%+ (سلم قابل للتعديل)
- لكل مستوى:
• لون / سماكة / ستايل (سوليد – دوتيد – داشد)
• ليبل سِعر مع Offset بـ ATR
- لچند يشرح لك Reload Zones: ضحلة / عادية / عميقة.
المتداول يستخدمه إزاي؟
بدل ما “تخمّن” فين تشتري وتبيع:
- تشتري الدِپ جوّه مناطق Reload بعد MegaBar صاعد.
- تبيع الريبوند جوّه Extensions بعد MegaBar هابط.
- عندك هيكل واضح للسوينج والسكالب من غير فوضى.
--------------------------------------------
C) VSA + لِيبلات على الشموع
- يكتشف أحداث VSA زي:
• No Demand / No Supply
• Stopping Volume
• Absorption
• Spring / Upthrust
• Buying / Selling Climax
• EVR (شموع مجنونة فوليومًا)
• Tests و Confirmed Signals عند الدعوم/المقاومات
- مع تحسينات:
• تحليل Body vs Range
• مين اللي غالب؟ جسم الشمعة ولا الذيول؟
• فلتر Momentum + Volume
المتداول يستخدمه إزاي؟
كل ليبل على الشمعة = كومنت من السمارت ماني:
- No Demand عند مقاومة + RVOL ضعيف → بلاش تشتري.
- Stopping Volume + Spring جوّه Reload Zone + VPOC → فرصة قوية للشراء.
- توصل بين VSA + Fib + VPOC فتفهم “مين بيكسب المعركة”.
--------------------------------------------
D) محرّك البريك آوت Supersonic
- بيحسب Score للقوة بتاعة البريك آوت من:
• RVOL + Volume Expansion
• توسّع السبريد مقارنة بالشموع السابقة
• جودة جسم الشمعة (جسم ولا ذيل)
• نسبة الوقت اللي عدّى من الشمعة الحالية
- يفرّق بين:
• بريك آوت محتمل vs مؤكد
• حركة قوية مدعومة بفوليوم vs “شمعة شو”
- يقدر يطلع ليبل Debug يشرح:
• Momentum Score
• Volume Ratio / RVOL
• Spread Behaviour
• Body Quality
• % الوقت اللي فات من عمر الشمعة
المتداول يستخدمه إزاي؟
ماتجريش ورا كل شمعة كبيرة:
- استنَى لما يكون الـ Score عالي،
- والفوليوم مصدّق الحركة،
- والهيكل (Fib / VPOC / CHoCH) موافق.
ساعتها بس البريك آوت يستاهل المخاطرة.
--------------------------------------------
E) VPOC / WVPOC + مناطق الفوليوم
- يرقب VPOC و WVPOC في الوقت الحقيقي.
- يحدّد Clusters مهمة تتحوّل لـ Support / Resistance محترم.
- يراقب كسر المناطق دي بفوليوم واضح (بداية موجة جديدة).
- SL و TP ديناميك:
• SL حوالين VPOC مع Buffer من ATR.
• TP متوزع على مستويات فيبوناتشي و زونات فوليوم.
المتداول يستخدمه إزاي؟
بتربط مخاطرتك بأين اشتغل الفوليوم التقيل:
- VPOC = منطق منطقي للستوب.
- Clusters = زون ضغط ينفع يبدأ منها ترند قوي.
--------------------------------------------
F) محرّك الدخول بتاع السمارت ماني (1h + 15m MegaBars)
- يجيب MegaBars بتاعة الساعة جوّه فريمات أقل بالـ `request.security`.
- يميّز:
• Confluence بين MegaBar الساعة + MegaBar الربع ساعة (صفقة A-Grade).
• MegaBar على فريم واحد بس (B-Grade).
- يجهّز تلقائيًا:
• Entry
• SL
• TP1–TP4 على Extensions و مستويات هيكلية.
- اللّيبلات تكتب:
• Entry = …
• SL = …
• TP1 = … / TP2 = … / TP3 = … / TP4 = …
مع تحكّم في حجم الخط و ATR Offset.
- فيه اختيار “أظهر آخر سيناريو بس” عشان الشارت يفضل نضيف.
- جاهز للـ Alerts لما الشروط تكمّل.
المتداول يستخدمه إزاي؟
يبقى عندك Execution Ladder كامل:
- فين تدخل،
- فين تحط الستوب،
- إزاي تقسم الخروج على أكتر من هدف.
--------------------------------------------
G) موديل الـ Reverse Fib (صفقات عكس الاتجاه)
- بيشتغل بعد ما السعر يبالغ في الحركة و يوصل Extensions معيّنة.
- يدور على:
• شموع رفض عند/بعد Extensions.
• Exhaustion + إشارة VSA.
- يرسم خطة عكسية:
• Entry عكسي من Extension Extreme.
• TP سلم مبني على 0.618, 0.786, 1.236, 1.382, 1.5, 1.618, 2.0, … إلخ
• SL و TSL مبنيين على ATR و مسافة الفيبوناتشي.
المتداول يستخدمه إزاي؟
لو انت ترند تريدر:
- تستخدمه عشان تقفل/تخفف عند تمدّد مبالغ فيه.
لو انت Counter-Trend:
- يديك سيناريو “فِيد” منطقي بمخاطرة محسوبة.
--------------------------------------------
H) سويپس لليكويديتي + CHoCH + Order Blocks + FVGs
- يوسم مناطق ضرب الستوبات فوق الهاي وتحت اللو (Liquidity Grabs).
- يحدد CHoCH لما الاتجاه يغيّر شخصيته مع فوليوم.
- يرصد Order Blocks أساسية (Bullish / Bearish).
- يظلّل الـ FVGs و يشيلها لما تتعبّى.
المتداول يستخدمه إزاي؟
تجمع بين:
MegaBar + VSA + Fib + VPOC + Liquidity:
- يا إمّا تلحق موجة نظيفة،
- يا إمّا تفِيد Stop Hunt غبي اتكشف على الشارت.
--------------------------------------------
I) داشبورد VSA + Breakout (Table اختياري)
- Table صغيرة فيها:
• حالة VSA
• قوة البريك آوت
• RVOL / Volume
• Spread & Candle Quality
• حالة ATR
• مكان الإغلاق جوّه الشمعة
• وضع VPOC
• نسبة الوقت اللي عدّى من الشمعة
المتداول يستخدمه إزاي؟
قبل ما تدوس Buy / Sell:
- تبص على التابل ثانيتين:
الدنيا شغّالة ولا لأ؟
فيه فوليوم؟ فيه ترند؟ ولا حركة ميتة؟
ده يقلل قرارات “من غير plan”.
3) سيناريو شغل متداول على XAUMO MegaBar VSA
1) اختار الفريم + الجلسة
- 15m أو 1h على XAUUSD.
- ظبّط سيشن لندن/نيويورك زي وقت شغلك الحقيقي.
2) اقرأ الكونتكست
- السوق بيبنِي مراكز؟ بيصفّي؟ ولا نايم؟
- إيه إشارات الـ VSA و Score البريك آوت؟
- فين VPOC / WVPOC من السعر؟
3) دور على MegaBar النشط و خريطة الفيبوناتشي بتاعته
- السعر:
• بيرجّع جوّه Reload Zone؟
• بيكسر البرنچ؟
• ولا داخل على Overextension؟
4) استنَى تأكيد السمارت ماني
- Confluence بين MegaBar الساعة والربع ساعة.
- Breakout Score محترم.
- VSA منطقي (No Demand, Stopping Volume, Spring, …).
- Structure: CHoCH / FVG / Liquidity Sweep في اتجاه الصفقة.
5) نفّذ باستخدام السلم المطبوع على الشارت
- استخدم Entry / SL / TP1–TP4 كـ هيكل أساسي.
- عدّل اللوت / الريسك حسب خطتك انت.
6) الإدارة والخروج
- استعمل ATR + VPOC في Trailing/Lock.
- لما Extensions تبان مبالغ فيها → ركّز على Reverse Fib.
4) المؤشّر ده مناسب لمين؟
- اللي بيتاجر دهب XAUUSD (CFD أو Spot) على 15m و 1h.
- اللي بيحب شغل مؤسّسات: Volume, VPOC, SMC, Fib مش مؤشرات بسيطة.
- اللي عايز Execution Plan جاهز (Entry/SL/TP) بس لسه عنده حريّة تعديل.
- اللي عايز يتعلّم VSA و Smart Money Concepts بشكل تطبيقي على شارت واحد.
5) إخلاء مسؤولية كامل (مهم تقراه)
- المؤشّر ده وكل الكلام اللي حواليه للتعليم بس.
- مش:
• نصيحة استثمارية،
• ولا توصية شراء/بيع،
• ولا خدمة إدارة محافظ،
• ولا سيجنال سيرڤس.
- التداول في الأسواق (خصوصًا المشتقات، الـ CFD، الفيوتشر) فيه مخاطرة عالية جدًا،
وممكن تخسر جزء كبير أو كل رأس مالك.
- أي أداء سابق، باك تست، أو مثال افتراضي → مش ضمان لنتيجة مستقبلية.
- أي نسبة احتمالات، Scores، أو “Quality” بيطلعها المؤشّر:
• دي حسابات كود، مش ضمان ربح،
• مش وعد ولا تعهّد بأي نتيجة.
- انت المسؤول 100% عن:
• حجم العقود اللي بتدخلها،
• الرافعة اللي بتستخدمها،
• أماكن الدخول والخروج،
• وإدارة المخاطرة بتاعتك،
• والتزامك بالقوانين والضرائب في بلدك.
- قبل ما تستخدم المؤشّر على حساب حقيقي:
• جرّب كويس على باك تست و فورورد تست،
• اشتغل فترة على Demo،
• لو محتاج نصيحة مالية شخصية → ارجع لمستشار مالي مرخَّص.
باختصار:
XAUMO MegaBar VSA ده أداة تعليمية وتحليلية قوية تساعدك تفهم حركة الذهب،
مش زرار “اطبع فلوس”.
انت صاحب القرار، وانت صاحب المسؤولية، وانت اللي بتتحمّل أي ربح أو خسارة.

Bullish Volume RatioBullish Volume Ratio (BVR) Indicator
The Bullish Volume Ratio (BVR) is a sophisticated momentum oscillator designed to measure the true intensity of buying pressure versus selling pressure in the market. It provides a unique, statistically-driven view of market conviction, making it an essential tool for traders who seek to confirm trend health and anticipate major shifts.
BVR achieves its precision by not only assessing net volume but also using proprietary volume weighting logic to gauge the quality of participation in each candle, filtering out market noise to present a clear picture of underlying demand.
Key Features
Statistically-Driven Conviction: The indicator utilizes a Z-Score to measure how far the current BVR reading deviates from its historical average, providing an objective measure of whether buying or selling is truly exceptional or just noise.
Clear Visual Signals: The oscillator plot is designed for clear interpretation on a separate pane, helping you identify regime shifts without cluttering the main price chart.
Real-Time Data Dashboard (Optional): A customizable table on the chart displays the current BVR, Z-score, and other critical volume metrics at a glance.
Simplified Trading Guide
The BVR indicator simplifies volume analysis into clear, actionable signals that can be used for trend confirmation and reversal anticipation.
1. Trend Confirmation
Use the BVR to confirm the momentum of an existing trend:
Bullish Confirmation: When price is trending up, look for the BVR line to be rising and consistently above the center line. This signals that buyers are in firm control and the uptrend has strong volume conviction.
Bearish Confirmation: When price is trending down, look for the BVR line to be falling and deep below the center line. This indicates sellers are dominating the volume profile, confirming the strength of the downtrend.
2. Identifying Trade Entry/Exit Zones
The indicator's Z-Score component is key to spotting extremes that often precede a reversal:
Potential Long Entry: Look for a sustained negative Z-Score followed by a sharp crossover back towards the center line or into positive territory. This can signal that selling pressure has reached an exhaustion point and accumulation (buying) is beginning.
Potential Short Entry: Look for a sustained positive Z-Score followed by a sharp crossover back towards the center line or into negative territory. This suggests that buying momentum is exhausted and distribution (selling) is commencing.
3. The Volume Spike Filter
The indicator also alerts you to candles with significantly high volume relative to the recent average. Use this as a filter:
Breakout Validation: A price breakout is more likely to be legitimate if it is accompanied by a high volume spike confirmed by a strong BVR reading in the direction of the breakout.
Reversal Warning: A high volume spike at a key support or resistance level, particularly one that leads to a sharp turn in the BVR, can strongly signal a climactic reversal in progress.

DTR Volume FVGDTR Volume FVG detects bullish and bearish Fair Value Gaps and shows how much volume occurred inside each gap. Instead of only drawing the imbalance, the indicator analyzes a lower timeframe and builds a small volume profile inside every FVG. This helps you understand which gaps are strong, weak, likely to hold, or likely to fill.
How It Works:
- The indicator finds FVGs using a lower timeframe (Auto mode or manual selection).
- Each FVG is drawn as a colored zone: green for bullish, purple for bearish.
- Inside the gap, the script shows volume distribution using horizontal boxes.
- The FVG extends forward in time until the gap is fully filled or invalidated.
- Once price closes through the gap, the zone is removed automatically.
How to Use:
- High volume inside the FVG suggests strong interest and possible support or resistance.
- Low volume suggests the gap may fill more easily.
- Bullish FVGs are used as retracement zones in uptrends.
- Bearish FVGs are used as retracement zones in downtrends.
- Use the Display option to hide the volume boxes if you want a cleaner chart.
Best For:
- Finding strong retracement zones
- Identifying which gaps matter
- Understanding how price and volume behaved during displacement
- Improving entries and stop placement with volume levels inside FVGs
This indicator gives a clearer view of which imbalances are important by combining FVG structure with real volume data.

Hammer Model [#]Hammer Model - HTF Candle Entry Model
Overview
The Hammer Model is a sophisticated technical indicator that identifies high-probability reversal setups based on Higher Timeframe (HTF) candlestick wick rejection patterns. Unlike traditional hammer pattern indicators that simply flag candle formations, this system provides a complete trading framework with precise entry zones, stop loss placement, and multiple take profit targets calculated using statistical projections.
What Makes This Different
Proprietary Signal Filtering: This indicator uses a proprietary algorithm that analyzes multiple market structure conditions to filter out low-quality hammer patterns. Only the highest-probability setups are displayed, significantly reducing false signals compared to standard pattern recognition tools.
Dynamic Quadrant Mapping: Rather than basic support/resistance levels, the system divides each qualified hammer candle into three distinct zones (Upper Wick, Body, and Lower Wick), with precise .25, .5, and .75 subdivision levels for granular entry and exit planning.
Multi-Standard Deviation Projections: The indicator automatically calculates TP1 and TP2 targets based on the wick's range, along with optional 1-4 standard deviation extension levels for position scaling and profit maximization.
How It Works
Signal Generation @ Candle Close/New Candle Open
The indicator monitors your chart for HTF candles that meet specific criteria:
Bullish Hammer: Lower wick must be significantly larger than the body
Bearish Hammer: Upper wick must be significantly larger than the body
When both wicks qualify, the indicator selects the larger wick as the primary signal, depending on conditions set.
Visual Components
Bullish Setups:
SL: Stop loss level (below lower wick)
ENTRY: Entry zone (candle body range)
.25/.5/.25: Wick quadrant levels for scaling entries
TP1/TP2: First and second take profit targets
1-4STDV: Advanced/Long Range Targets
Bearish Setups:
SL: Stop loss level (above upper wick)
ENTRY: Entry zone (candle body range)
.25/.5/.25: Wick quadrant levels for scaling entries
TP1/TP2: First and second take profit targets
1-4STDV: Advanced/Long Range Targets
HTF Candle Overlay (Optional):
Displays the actual HTF candle that generated the signal
Shows Open, High, Low, and Close lines for context
Trading the Signals
For Bullish Hammers (Long):
Entry is @ HTF Candle Close / New HTF Candle Open (or wait for a .25-.5 wick retrace)
Place stop loss at or 1 tick below the SL level (lower wick low)
Target TP1 (1x wick range above) and TP2 (2x wick range above) and STDV
Use .25/.5/.25 levels to scale into positions or manage partial exits
For Bearish Hammers (Short):
Entry is @ HTF Candle Close / New HTF Candle Open (or wait for a .25-.5 wick retrace)
Place stop loss at or above the SL level (upper wick high)
Target TP1 (1x wick range below) and TP2 (2x wick range below) and STDV
Use .25/.5/.25 levels to scale into positions or manage partial exits
Key Settings
Hammer Model Conditions
Bullish/Bearish: Toggle which direction setups to display
1-2STDV / 3-4STDV: Show extended projection levels
HTF Liquidity Sweep: Filter for setups that swept previous HTF highs/lows (proprietary)
Wick Size: Require larger wick-to-body ratio (1.75x vs 1x)
Time Filters: Isolate setups during specific trading sessions (NY AM/PM, Asia, London)
Hourly Filters: Target setups that form during specific hour segments (useful for lower timeframes)
Display Options
Show Recent Hammer Models: Limit how many setups display on chart (default: 4)
Unlimited: Show all historical setups
Candle Quadrants: Toggle .25, .5, .25 subdivision lines
HTF Candle Overlay: Display the actual HTF candle that generated the signal
Timeframes
1min chart → 15min HTF (scalping)
5min chart → 1H HTF (day trading)
15min chart → 4H HTF (swing trading)
1H chart → Daily HTF (position trading)
The indicator automatically selects appropriate HTF pairs
Why Closed Source
This indicator is closed source to protect proprietary filtering algorithms that determine which hammer patterns qualify as valid signals. These filters analyze specific market structure conditions, liquidity dynamics, and statistical thresholds that have been developed through extensive backtesting, data logging over 1 years time, and represent the core intellectual property of this system. The filtering methodology is what separates this from basic pattern recognition tools and delivers higher-probability setups. To learn how to learn more about this system see Author Notes.
Best Practices
Confluence: Use this indicator alongside trend analysis, key support/resistance levels, or volume profiles
Risk Management: The SL levels provide clear invalidation points - always honor them
Scaling: Use the quadrant levels (.25/.5/.25) to scale into positions rather than entering full size at once
Session Filters: Enable time filters to focus on setups during high-liquidity sessions
Backtesting: Review historical signals on your preferred instruments to understand typical behavior and win rates
Notes
The indicator displays a table in the top-right showing the current chart timeframe and HTF being analyzed
Only charts with sufficient historical data will display all past signals
The "Unlimited" option may cause performance issues on very low timeframes with extensive history
Disclaimer: This indicator is a tool for technical analysis and risk management education and does not guarantee profitable trades. Always practice proper risk management and position sizing. Past performance does not indicate future results

Orderbook Table1. Indicator Name
Orderbook Table
This is an order book style trading volume map
that upgraded the price from my first script to label
2. One-line Introduction
A visual heatmap-style orderbook simulator that displays volume and delta clustering across price levels.
3. Overall Description
Orderbook Table is a powerful visual tool designed to replicate an on-chart approximation of a traditional order book.
It scans historical candles within a specified lookback window and accumulates traded volume into price "bins" or levels.
Each level is color-coded based on total volume and directional bias (delta), offering a layered view of where market interest was concentrated.
The indicator approximates order flow by analyzing each candle's directional volume, separating bullish and bearish volume.
With adjustable parameters such as level depth, price bin density, delta sensitivity, and opacity, it provides a highly customizable visualization.
Displayed directly on the chart, each level shows the volume at that price zone, along with a price label, offset to the right of the current bar.
Traders can use this tool to detect high liquidity zones, support/resistance clusters, and volume imbalances that may precede future price movements.
4. Key Benefits (Title + Description)
✅ On-Chart Volume Heatmap
Shows volume distribution across price levels in real-time directly on the price chart, creating a live “orderbook” view.
✅ Delta-Based Bias Coloring
Color changes based on net buying/selling pressure (delta), making aggressive demand/supply zones easy to spot.
✅ High Customizability
Users can adjust lookback bars, price bins, opacity levels, and delta usage to fit any market condition or asset class.
✅ Lightweight Simulation
Approximates orderbook depth using candle data without needing L2 feed access—works on all assets and timeframes.
✅ Clear Visual Anchoring
Volume quantities and price levels are offset to the right for easy viewing without cluttering the active chart area.
✅ Fast Market Context Recognition
Quickly identify price levels where volume concentrated historically, improving decision-making for entries/exits.
5. Indicator User Guide
📌 Basic Concept
Orderbook Table analyzes a configurable number of past bars and distributes traded volume into price "bins."
Each bin shows how much volume occurred around that price level, optionally adjusted for bullish/bearish candle direction.
⚙️ Settings Overview
Lookback Bars: Number of candles to scan for volume history
Levels (Total): Number of price levels to display around the current price
Price Bins: Granularity of price segmentation for volume distribution
Shift Right: How far to offset labels to the right of the current bar
Max/Min Opacity: Controls visual strength of volume coloring
Use Candle Delta Approx.: If enabled, colors the volume based on candle direction (green for up, red for down)
📈 Example Timing
Look for green clusters (bullish bias) below current price → possible strong demand zones
Price enters a high-volume level with previously aggressive buyers (green), suggesting support
📉 Example Timing
Red clusters (bearish bias) above current price can act as resistance or supply zones
Price stalling at a red-heavy volume band may indicate exhaustion or reversal opportunity
🧪 Recommended Use
Use as a support/resistance mapping tool in ranging and trending markets
Pair with candlestick analysis or momentum indicators for refined entry/exit points
Combine with VWAP or volume profile for multi-dimensional volume insight
🔒 Cautions
This is an approximation, not a true L2 orderbook—volume is based on historical candles, not actual limit order data
In low-volume markets or higher timeframes, bin granularity may be too coarse—adjust "Price Bins" accordingly
Delta calculation is based on open-close direction and does not reflect true buy/sell volume splits
Avoid overinterpreting low-opacity (light color) zones—they may indicate low interest rather than true resistance/support
+++

Wyckoff Accumulation/Distribution - Enhanced by ChakraWyckoff Accumulation/Distribution - Enhanced Indicator
Overview
An advanced Pine Script v6 indicator that detects Wyckoff accumulation and distribution patterns using RSI-based trend analysis, pivot detection, and volume confirmation. This enhanced version improves upon traditional Wyckoff indicators with cleaner code, English variable names, and additional market structure signals.
Key Features
Wyckoff Phase Detection
Accumulation Phase:
SC (Selling Climax): Bottom pivot with extreme bearish RSI and high volume
AR (Automatic Rally): First bounce after selling climax
ST (Secondary Test): Retest of lows without extreme RSI
SOS (Sign of Strength): Strong bullish breakout with volume confirmation ⭐ NEW
Distribution Phase:
BC (Buying Climax): Top pivot with extreme bullish RSI and high volume
DAR (Automatic Reaction): First drop after buying climax
DST (Distribution Secondary Test): Retest of highs
SOW (Sign of Weakness): Strong bearish breakdown with volume confirmation ⭐ NEW
Market Structure Events
Spring: False breakdown (RSI crosses above lower band) with background highlight
UTAD (Upthrust After Distribution): False breakout (RSI crosses below upper band) with background highlight
Visual Features
Range Boxes: Automatically draws consolidation ranges (gray) that change color on breakout:
🟢 Green = Accumulation (bullish breakout)
🔴 Red = Distribution (bearish breakout)
Pivot Markers: Orange triangles show regular (non-Wyckoff) pivot points
Bar Coloring: Lime bars for bullish trends, purple bars for bearish trends
Color-Coded Labels: All Wyckoff events clearly marked with descriptive text
Customizable Settings
RSI Settings:
RSI Length (default: 14)
Trend Sensitivity (default: 20) - Higher values = more sideways detection
Pivot Settings:
Pivot Length (default: 5) - Controls pivot point detection sensitivity
Display Options:
Toggle range boxes on/off
Toggle regular pivot markers
Toggle bar coloring by trend
Customize label text color
Advanced Detection:
Volume Confirmation toggle - Require high volume for climax events
Volume Threshold (default: 1.5x) - Adjustable volume multiplier
Alerts
8 comprehensive alert conditions:
Selling Climax (SC)
Buying Climax (BC)
Spring detection
UTAD detection
Sign of Strength (SOS)
Sign of Weakness (SOW)
Range Breakout
Improvements Over Original
✅ Pine Script v6 (latest version)
✅ English variable names (was Turkish)
✅ Fixed DAR label bug (was showing "AR")
✅ Added SOS (Sign of Strength) detection
✅ Added SOW (Sign of Weakness) detection
✅ Optional volume confirmation toggle
✅ Organized input groups for better UX
✅ Enhanced visual options
✅ Comprehensive alert system
✅ Cleaner, more maintainable code structure
Best Use Cases
Timeframes: Works on all timeframes; best on 4H, Daily, or Weekly
Markets: Stocks, Forex, Crypto, Indices
Trading Style: Swing trading, position trading, market structure analysis
Combine With: Support/Resistance, Volume Profile, Order Flow analysis
How It Works
The indicator uses RSI to identify market states (sideways, bullish, bearish) and combines this with pivot point detection and volume analysis to identify key Wyckoff events. When price is ranging (RSI between upper/lower bands), it draws a box. On breakout, the box color changes to indicate accumulation or distribution, helping traders identify smart money positioning.
Tips for Use
Lower Trend Sensitivity (10-15) for more signals in trending markets
Higher Trend Sensitivity (25-30) for clearer signals in choppy markets
Enable Volume Confirmation in high-volume markets (stocks, major crypto)
Disable Volume Confirmation in low-volume or forex markets
Watch for Spring/UTAD events within boxes for potential reversals
Version: 1.0
Pine Script: v6
Author: Chakrapani Chittabathina

Day-Type Detector — Rejection / FNL / Outside / StopRun (Clean)Day-Type Detector — Rejection / FNL / Outside / Stop-Run (Clean Version)
This indicator identifies four high-impact candlestick day-types commonly used in professional price-action and auction-market trading: Rejection Days, Failed New Low (FNL) Days, Outside Days, and Stop-Run Days. These patterns often precede major directional moves, reversals, and absorption events, making them particularly valuable for swing traders, positional traders, and short-term discretionary traders.
The script is designed to work across all timeframes and is built around volatility-adjusted measurements using Average Daily Range (ADR) for accuracy and consistency.
What This Indicator Detects
1. Rejection Day (Bullish & Bearish)
A Rejection Day is a wide-range bar that rejects a previous extreme.
The indicator identifies rejection based on:
Range > ADR × threshold
Long lower wick (for bullish) or long upper wick (for bearish)
Close located in the strong zone of the day’s range
These conditions highlight areas where aggressive counter-orderflow entered the market.
2. Failed New Low (FNL) / Failed New High
An FNL day traps traders who attempted breakout selling or buying.
The indicator checks for:
A break beyond the previous session’s low or high
Immediate rejection back inside
Midpoint recapture conditions
ADR-normalized range requirements
These days often trigger powerful directional reversals.
3. Outside Day (Bullish & Bearish)
An Outside Day is a statistically significant expansion day that breaks both the previous high and low.
The script validates:
High > previous high and low < previous low
Range > ADR threshold
Close beyond prior session extreme to complete the rejection sequence
Outside Days often represent stop runs, shakeouts, or trend accelerations.
4. Stop-Run Day (Bullish & Bearish)
Stop-Run Days are aggressive volatility expansions and tend to be the largest ranges within short windows.
This detector identifies them using:
Range > ADR × multiplier
Close located near the extreme of the day (top for bullish, bottom for bearish)
Strong body relative to total range
Break above/below previous session extreme
These patterns indicate capitulation or forced liquidation and are often followed by continuation or sharp counter-rotation.
Key Features
✔ Historical Pattern Marking
All qualifying bars are marked on the chart using plotshape() in global scope, ensuring full historical visibility.
✔ Event Logging & Table Display
A table (top-right of the chart) displays the most recent pattern detections, including:
Timestamp
Pattern type
Bar index
This allows users to monitor and study past pattern occurrences without scanning the chart manually.
✔ ADR-Adjusted Detection
Volatility uncertainty is removed by anchoring all thresholds to ADR.
This ensures consistency across:
Different symbols
Different timeframes
Different market regimes
✔ Alerts Included
Alerts are preconfigured for:
Rejection Day Bull / Bear
FNL Bull / Bear
Outside Day Bull / Bear
Stop-Run Bull / Bear
This allows the user to receive real-time notifications when major day-type structures develop.
How to Use
Add the indicator to any timeframe chart.
Enable or disable:
Historical markers
History table
ADR diagnostics
Watch for shape markers or use alerts for real-time signals.
Use the history table to review recent occurrences.
Combine these day-types with:
Market structure levels
High/low volume nodes (LVNs)
Support/resistance zones
Trend context
These day-types are most effective when they occur near meaningful structural levels because they show where strong order-flow entered the market.
Best Practices
Use higher timeframes (1H–1D) for swing entries.
Confirm signals with market structure or volume profile.
Treat these day-types as context, not standalone signals.
Observe follow-through behavior in the next 1–3 bars after detection.
Credits
This script is based on concepts commonly seen in auction-market theory and professional price-action frameworks, such as Rejection Days, Failed New Lows, Outside Days, and Stop-Run behaviors.
All calculations and logic have been rebuilt from scratch to ensure clean, reliable, and optimized Pine Script v6 execution.

Chronos Reversal Labs - SPChronos Reversal Labs - Shadow Portfolio
Chronos Reversal Labs - Shadow Portfolio: combines reinforcement learning optimization with adaptive confluence detection through a shadow portfolio system. Unlike traditional indicator mashups that force traders to manually interpret conflicting signals, this system deploys 4 multi-armed bandit algorithms to automatically discover which of 5 specialized confluence strategies performs best in current market conditions, then validates those discoveries through parallel shadow portfolios that track virtual P&L for each strategy independently.
Core Innovation: Rather than relying on static indicator combinations, this system implements Thompson Sampling (Bayesian multi-armed bandits), contextual bandits (regime-specific learning), advanced chop zone detection (geometric pattern analysis), and historical pre-training to build a self-improving confluence detection engine. The shadow portfolio system runs 5 parallel virtual trading accounts—one per strategy—allowing the system to learn which confluence approach works best through actual position tracking with realistic exits.
Target Users: Intermediate to advanced traders seeking systematic reversal signals with mathematical rigor. Suitable for swing trading and day trading across stocks, forex, crypto, and futures on liquid instruments. Requires understanding of basic technical analysis and willingness to allow 50-100 bars for initial learning.
Why These Components Are Combined
The Fundamental Problem
No single confluence method works consistently across all market regimes. Kernel-based methods (entropy, DFA) excel during predictable phases but fail in chaos. Structure-based methods (harmonics, BOS) work during clear swings but fail in ranging conditions. Technical methods (RSI, MACD, divergence) provide reliable signals in trends but generate false signals during consolidation.
Traditional solutions force traders to either manually switch between methods (slow, error-prone) or interpret all signals simultaneously (cognitive overload). Both fail because they assume the trader knows which regime the market is in and which method works best.
The Solution: Meta-Learning Through Reinforcement Learning
This system solves the problem through automated strategy selection : Deploy 5 specialized confluence strategies designed for different market conditions, track their real-world performance through shadow portfolios, then use multi-armed bandit algorithms to automatically select the optimal strategy for the next trade.
Why Shadow Portfolios? Traditional bandit implementations use abstract "rewards." Shadow portfolios provide realistic performance measurement : Each strategy gets a virtual trading account with actual position tracking, stop-loss management, take-profit targets, and maximum holding periods. This creates risk-adjusted learning where strategies are evaluated on P&L, win rate, and drawdown—not arbitrary scores.
The Five Confluence Strategies
The system deploys 5 orthogonal strategies with different weighting schemes optimized for specific market conditions:
Strategy 1: Kernel-Dominant (Entropy/DFA focused, optimal in predictable markets)
Shannon Entropy weight × 2.5, DFA weight × 2.5
Detects low-entropy predictable patterns and DFA persistence/mean-reversion signals
Failure mode: High-entropy chaos (hedged by Technical-Dominant)
Strategy 2: Structure-Dominant (Harmonic/BOS focused, optimal in clear swing structures)
Harmonics weight × 2.5, Liquidity (S/R) weight × 2.0
Uses swing detection, break-of-structure, and support/resistance clustering
Failure mode: Range-bound markets (hedged by Balanced)
Strategy 3: Technical-Dominant (RSI/MACD/Divergence focused, optimal in established trends)
RSI weight × 2.0, MACD weight × 2.0, Trend weight × 2.0
Zero-lag RSI suite with 4 calculation methods, MACD analysis, divergence detection
Failure mode: Choppy/ranging markets (hedged by chop filter)
Strategy 4: Balanced (Equal weighting, optimal in unknown/transitional regimes)
All components weighted 1.2×
Baseline performance during regime uncertainty
Strategy 5: Regime-Adaptive (Dynamic weighting by detected market state)
Chop zones: Kernel × 2.0, Technical × 0.3
Bull/Bear trends: Trend × 1.5, DFA × 2.0
Ranging: Mean reversion × 1.5
Adapts explicitly to detected regime
Multi-Armed Bandit System: 4 Core Algorithms
What Is a Multi-Armed Bandit Problem?
Formal Definition: K arms (strategies), each with unknown reward distribution. Goal: Maximize cumulative reward while learning which arms are best. Challenge: Balance exploration (trying uncertain strategies) vs. exploitation (using known-best strategy).
Trading Application: Each confluence strategy is an "arm." After each trade, receive reward (P&L percentage). Bandits decide which strategy to trust for next signal.
The 4 Implemented Algorithms
1. Thompson Sampling (DEFAULT)
Category: Bayesian approach with probability distributions
How It Works: Model each strategy as Beta(α, β) where α = wins, β = losses. Sample from distributions, select highest sample.
Properties: Optimal regret O(K log T), automatic exploration-exploitation balance
When To Use: Best all-around choice, adaptive markets, long-term optimization
2. UCB1 (Upper Confidence Bound)
Category: Frequentist approach with confidence intervals
Formula: UCB_i = reward_mean_i + sqrt(2 × ln(total_pulls) / pulls_i)
Properties: Deterministic, interpretable, same optimal regret as Thompson
When To Use: Prefer deterministic behavior, stable markets
3. Epsilon-Greedy
Category: Simple baseline with random exploration
How It Works: With probability ε (0.15): random strategy. Else: best average reward.
Properties: Simple, fast initial learning
When To Use: Baseline comparison, short-term testing
4. Contextual Bandit
Category: Context-aware Thompson Sampling
Enhancement: Maintains separate alpha/beta for Bull/Bear/Ranging regimes
Learning: "Strategy 2: 60% win rate in Bull, 40% in Bear"
When To Use: After 100+ bars, clear regime shifts
Shadow Portfolio System
Why Shadow Portfolios?
Traditional bandits use abstract scores. Shadow portfolios provide realistic performance measurement through actual position simulation.
How It Works
Position Opening:
When strategy generates validated signal:
Opens virtual position for selected strategy
Records: entry price, direction, entry bar, RSI method
Optional: Open positions for ALL strategies simultaneously (faster learning)
Position Management (Every Bar):
Current P&L: pnl_pct = (close - entry) / entry × direction × 100
Exit if: pnl_pct <= -2.0% (stop-loss) OR pnl_pct >= +4.0% (take-profit) OR held ≥ 100 bars (time)
Position Closing:
Calculate final P&L percentage
Update strategy equity, track win rate, gross profit/loss, max drawdown
Calculate risk-adjusted reward:
text
base_reward = pnl_pct / 10.0
win_rate_bonus = (win_rate - 0.5) × 0.3
drawdown_penalty = -max_drawdown × 0.05
total_reward = sigmoid(base + bonus + penalty)
Update bandit algorithms with reward
Update RSI method bandit
Statistics Tracked Per Strategy:
Equity curve (starts at $10,000)
Win rate percentage
Max drawdown
Gross profit/loss
Current open position
This creates closed-loop learning : Strategies compete → Best performers selected → Bandits learn quality → System adapts automatically.
Historical Pre-Training System
The Problem with Live-Only Learning
Standard bandits start with zero knowledge and need 50-100 signals to stabilize. For weekly timeframe traders, this could take years.
The Solution: Historical Training
During Chart Load: System processes last 300-1000 bars (configurable) in "training mode":
Detect signals using Balanced strategy (consistent baseline)
For each signal, open virtual training positions for all 5 strategies
Track positions through historical bars using same exit logic (SL/TP/time)
Update bandit algorithms with historical outcomes
CRITICAL TRANSPARENCY: Signal detection does NOT look ahead—signals use only data available at entry bar. Exit tracking DOES look ahead (uses future bars for SL/TP), which is acceptable because:
✅ Entry decisions remain valid (no forward bias)
✅ Learning phase only (not affecting shown signals)
✅ Real-time mirrors training (identical exit logic)
Training Completion: Once chart reaches current bar, system transitions to live mode. Dashboard displays training vs. live statistics for comparison.
Benefit: System begins live trading with 100-500 historical trades worth of learning, enabling immediate intelligent strategy selection.
Advanced Chop Zone Detection Engine
The Innovation: Multi-Layer Geometric Chop Analysis
Traditional chop filters use simple volatility metrics (ATR thresholds) that can't distinguish between trending volatility (good for signals) and choppy volatility (bad for signals). This system implements three-layer geometric pattern analysis to precisely identify consolidation zones where reversal signals fail.
Layer 1: Micro-Structure Chop Detection
Method: Analyzes micro pivot points (5-bar left, 2-bar right) to detect geometric compression patterns.
Slope Analysis:
Calculates slope of pivot high trendline and pivot low trendline
Compression ratio: compression = slope_high - slope_low
Pattern Classification:
Converging slopes (compression < -0.05) → "Rising Wedge" or "Falling Wedge"
Flat slopes (|slope| < 0.05) → "Rectangle"
Parallel slopes (|compression| < 0.1) → "Channel"
Expanding slopes → "Expanding Range"
Chop Scoring:
Rectangle pattern: +15 points (highest chop)
Low average slope (<0.05): +15 points
Wedge patterns: +12 points
Flat structures: +10 points
Why This Works: Geometric patterns reveal market indecision. Rectangles and wedges create false breakouts that trap technical traders. By quantifying geometric compression, system detects these zones before signals fire.
Layer 2: Macro-Structure Chop Detection
Method: Tracks major swing highs/lows using ATR-based deviation threshold (default 2.0× ATR), projects channel boundaries forward.
Channel Position Calculation:
proj_high = last_swing_high + (swing_high_slope × bars_since)
proj_low = last_swing_low + (swing_low_slope × bars_since)
channel_width = proj_high - proj_low
position = (close - proj_low) / channel_width
Dead Zone Detection:
Middle 50% of channel (position 0.25-0.75) = low-conviction zone
Score increases as price approaches center (0.5)
Chop Scoring:
Price in dead zone: +15 points (scaled by centrality)
Narrow channel width (<3× ATR): +15 points
Channel width 3-5× ATR: +10 points
Why This Works: Price in middle of range has equal probability of moving either direction. Institutional traders avoid mid-range entries. By detecting "dead zones," system avoids low-probability setups.
Layer 3: Volume Chop Scoring
Method: Low volume indicates weak conviction—precursor to ranging behavior.
Scoring:
Volume < 0.5× average: +20 points
Volume 0.5-0.8× average: +15 points
Volume 0.8-1.0× average: +10 points
Overall Chop Intensity & Signal Filtering
Total Chop Calculation:
chop_intensity = micro_score + macro_score + (volume_score × volume_weight)
is_chop = chop_intensity >= 40
Signal Filtering (Three-Tier Approach):
1. Signal Blocking (Intensity > 70):
Extreme chop detected (e.g., tight rectangle + dead zone + low volume)
ALL signals blocked regardless of confluence
Chart displays red/orange background shading
2. Threshold Adjustment (Intensity 40-70):
Moderate chop detected
Confluence threshold increased: threshold += (chop_intensity / 50)
Only highest-quality signals pass
3. Strategy Weight Adjustment:
During Chop: Kernel-Dominant weight × 2.0 (entropy detects breakout precursors), Technical-Dominant weight × 0.3 (reduces false signals)
After Chop Exit: Weights revert to normal
Why This Three-Tier Approach Is Original: Most chop filters simply block all signals (loses breakout entries). This system adapts strategy selection during chop—allowing Kernel-Dominant (which excels at detecting low-entropy breakout precursors) to operate while suppressing Technical-Dominant (which generates false signals in consolidation). Result: System remains functional across full market regime spectrum.
Zero-Lag Filter Suite with Dynamic Volatility Scaling
Zero-Lag ADX (Trend Regime Detection)
Implementation: Applies ZLEMA to ADX components:
lag = (length - 1) / 2
zl_source = source + (source - source ) × strength
Dynamic Volatility Scaling (DVS):
Calculates volatility ratio: current_ATR / ATR_100period_avg
Adjusts ADX length dynamically: High vol → shorter length (faster), Low vol → longer length (smoother)
Regime Classification:
ADX > 25 with +DI > -DI = Bull Trend
ADX > 25 with -DI > +DI = Bear Trend
ADX < 25 = Ranging
Zero-Lag RSI Suite (4 Methods with Bandit Selection)
Method 1: Standard RSI - Traditional Wilder's RSI
Method 2: Ehlers Zero-Lag RSI
ema1 = ema(close, length)
ema2 = ema(ema1, length)
zl_close = close + (ema1 - ema2)
Method 3: ZLEMA RSI
lag = (length - 1) / 2
zl_close = close + (close - close )
Method 4: Kalman-Filtered RSI - Adaptive smoothing with process/measurement noise
RSI Method Bandit: Separate 4-arm bandit learns which calculation method produces best results. Updates independently after each trade.
Kalman Adaptive Filters
Fast Kalman: Low process noise → Responsive to genuine moves
Slow Kalman: Higher measurement noise → Filters noise
Application: Crossover logic for trend detection, acceleration analysis for momentum inflection
What Makes This Original
Innovation 1: Shadow Portfolio Validation
First TradingView script to implement parallel virtual portfolios for multi-armed bandit reward calculation. Instead of abstract scoring metrics, each strategy's performance is measured through realistic position tracking with stop-loss, take-profit, time-based exits, and risk-adjusted reward functions (P&L + win rate + drawdown). This provides orders-of-magnitude better reward signal quality for bandit learning than traditional score-based approaches.
Innovation 2: Three-Layer Geometric Chop Detection
Novel multi-scale geometric pattern analysis combining: (1) Micro-structure slope analysis with pattern classification (wedges, rectangles, channels), (2) Macro-structure channel projection with dead zone detection, (3) Volume confirmation. Unlike simple volatility filters, this system adapts strategy weights during chop —boosting Kernel-Dominant (breakout detection) while suppressing Technical-Dominant (false signal reduction)—allowing operation across full market regime spectrum without blind signal blocking.
Innovation 3: Historical Pre-Training System
Implements two-phase learning : Training phase (processes 300-1000 historical bars on chart load with proper state isolation) followed by live phase (real-time learning). Training positions tracked separately from live positions. System begins live trading with 100-500 trades worth of learned experience. Dashboard displays training vs. live performance for transparency.
Innovation 4: Contextual Multi-Armed Bandits with Regime-Specific Learning
Beyond standard bandits (global strategy quality), implements regime-specific alpha/beta parameters for Bull/Bear/Ranging contexts. System learns: "Strategy 2: 60% win rate in ranging markets, 45% in bull trends." Uses current regime's learned parameters for strategy selection, enabling regime-aware optimization.
Innovation 5: RSI Method Meta-Learning
Deploys 4 different RSI calculation methods (Standard, Ehlers ZL, ZLEMA, Kalman) with separate 4-arm bandit that learns which calculation works best. Updates RSI method bandit independently based on trade outcomes, allowing automatic adaptation to instrument characteristics.
Innovation 6: Dynamic Volatility Scaling (DVS)
Adjusts ALL lookback periods based on current ATR ratio vs. 100-period average. High volatility → shorter lengths (faster response). Low volatility → longer lengths (smoother signals). Applied system-wide to entropy, DFA, RSI, ADX, and Kalman filters for adaptive responsiveness.
How to Use: Practical Guide
Initial Setup (5 Minutes)
Theory Mode: Start with "BALANCED" (APEX for aggressive, CONSERVATIVE for defensive)
Enable RL: Toggle "Enable RL Auto-Optimization" to TRUE, select "Thompson Sampling"
Enable Confluence Modules: Divergence, Volume Analysis, Liquidity Mapping, RSI OB/OS, Trend Analysis, MACD (all recommended)
Enable Chop Filter: Toggle "Enable Chop Filter" to TRUE, sensitivity 1.0 (default)
Historical Training: Enable "Enable Historical Pre-Training", set 300-500 bars
Dashboard: Enable "Show Dashboard", position Top Right, size Large
Learning Phase (First 50-100 Bars)
Monitor Thompson Sampling Section:
Alpha/beta values should diverge from initial 1.0 after 20-30 trades
Expected win% should stabilize around 55-60% (excellent), >50% (acceptable)
"Pulls" column should show balanced exploration (not 100% one strategy)
Monitor Shadow Portfolios:
Equity curves should diverge (different strategies performing differently)
Win rate > 55% is strong
Max drawdown < 15% is healthy
Monitor Training vs Live (if enabled):
Delta difference < 10% indicates good generalization
Large negative delta suggests overfitting
Large positive delta suggests system adapting well
Optimization:
Too few signals: Lower "Base Confluence Threshold" to 2.5-3.0
Too many signals: Raise threshold to 4.0-4.5
One strategy dominates (>80%): Increase "Exploration Rate" to 0.20-0.25
Excessive chop blocking: Lower "Chop Sensitivity" to 0.7-0.8
Signal Interpretation
Dashboard Indicators:
"WAITING FOR SIGNAL": No confluence
"LONG ACTIVE ": Validated long entry
"SHORT ACTIVE ": Validated short entry
Chart Visuals:
Triangle markers: Entry signal (green = long, red = short)
Orange/red background: Chop zone
Lines: Support/resistance if enabled
Position Management
Entry: Enter on triangle marker, confirm direction matches dashboard, check confidence >60%
Stop-Loss: Entry ± 1.5× ATR or at structural swing point
Take-Profit:
TP1: Entry + 1.5R (take 50%, move SL to breakeven)
TP2: Entry + 3.0R (runner) or trail
Position Sizing:
Risk per trade = 1-2% of capital
Position size = (Account × Risk%) / (Entry - SL)
Recommended Settings by Instrument
Stocks (Large Cap): Balanced mode, Threshold 3.5, Thompson Sampling, Chop 1.0, 15min-1H, Training 300-500 bars
Forex Majors: Conservative-Balanced mode, Threshold 3.5-4.0, Thompson Sampling, Chop 0.8-1.0, 5min-30min, Training 400-600 bars
Cryptocurrency: Balanced-APEX mode, Threshold 3.0-3.5, Thompson Sampling, Chop 1.2-1.5, 15min-4H, Training 300-500 bars
Futures: Balanced mode, Threshold 3.5, UCB1 or Thompson, Chop 1.0, 5min-30min, Training 400-600 bars
Technical Approximations & Limitations
1. Thompson Sampling: Pseudo-Random Beta Distribution
Standard: Cryptographic RNG with true beta sampling
This Implementation: Box-Muller transform using market data as entropy source
Impact: Not cryptographically random but maintains exploration-exploitation balance. Sufficient for strategy selection.
2. Shadow Portfolio: Simplified Execution Model
Standard: Order book simulation with slippage, partial fills
This Implementation: Perfect fills at close price, no fees modeled
Impact: Real-world performance ~0.1-0.3% worse per trade due to execution costs.
3. Historical Training: Forward-Looking for Exits Only
Entry signals: Use only past data (causal, no bias)
Exit tracking: Uses future bars to determine SL/TP (forward-looking)
Impact: Acceptable because: (1) Entry logic remains valid, (2) Live trading mirrors training, (3) Improves learning quality. Training win rates reflect 8-bar evaluation window—live performance may differ if positions held longer.
4. Shannon Entropy & DFA: Simplified Calculations
Impact: 10-15% precision loss vs. academic implementations. Still captures predictability and persistence signals effectively.
General Limitations
No Predictive Guarantee: Past performance ≠ future results
Learning Period Required: Minimum 50-100 bars for stable statistics
Overfitting Risk: May not generalize to unprecedented conditions
Single-Instrument: No multi-asset correlation or sector context
Execution Assumptions: Degrades in illiquid markets (<100k volume), major news events, flash crashes
Risk Warnings & Disclaimers
No Guarantee of Profit: All trading involves substantial risk of loss. This indicator is a tool, not a guaranteed profit system.
System Failures: Software bugs possible despite testing. Use appropriate position sizing.
Market Regime Changes: Performance may degrade during extreme volatility (VIX >40), low liquidity periods, or fundamental regime shifts.
Broker-Specific Issues: Real-world execution includes slippage (0.1-0.5%), commissions, overnight financing costs, partial fills.
Forward-Looking Bias in Training: Historical training uses 8-bar forward window for exit evaluation. Dashboard "Training Win%" reflects this method. Real-time performance may differ.
Appropriate Use
This Indicator IS:
✅ Entry trigger system with confluence validation
✅ Risk management framework (automated SL/TP)
✅ Adaptive strategy selection engine
✅ Learning system that improves over time
This Indicator IS NOT:
❌ Complete trading strategy (requires position sizing, portfolio management)
❌ Replacement for due diligence
❌ Guaranteed profit generator
❌ Suitable for complete beginners
Recommended Complementary Analysis: Market context, volume profile, fundamental catalysts, higher timeframe alignment, support/resistance from other sources.
Conclusion
Chronos Reversal Labs V2.0 - Elite Edition synthesizes research from multi-armed bandit theory (Thompson Sampling, UCB, contextual bandits), market microstructure (geometric chop detection, zero-lag filters), and machine learning (shadow portfolio validation, historical pre-training, RSI method meta-learning).
Unlike typical indicator mashups, this system implements mathematically rigorous bandit algorithms with realistic performance validation, three-layer chop detection with adaptive strategy weighting, regime-specific learning, and full transparency on approximations and limitations.
The system is designed for intermediate to advanced traders who understand that no indicator is perfect, but through proper machine learning and realistic validation, we can build systems that improve over time and adapt to changing markets without manual intervention.
Use responsibly. Understand the limitations. Risk disclosure applies. Past performance does not guarantee future results.
Taking you to school. — Dskyz, Trade with insight. Trade with anticipation.

VWAP + Volume Spikes See Where Smart Money ExhaustsVolume tells the truth. VWAP tells the bias. This script shows both — live.
If you trade intraday momentum, reversals, or liquidity sweeps, this indicator is built for you.
It shows where volume spikes hit extreme levels, anchored around VWAP and its dynamic bands, so you can instantly spot capitulation or hidden absorption.
🎯 What This Indicator Does
✅ Plots VWAP — session-anchored, updates automatically
✅ Adds dynamic VWAP bands — standard deviation envelopes showing volatility context
✅ Highlights volume spikes — colored candles + background for abnormal prints
✅ Includes alerts — “Volume Spike”, “VWAP Cross”, or a combined alert with direction
✅ Clean visual design — instantly readable in fast markets
It’s your visual orderflow radar — whether you’re trading gold, indices, or small caps.
🔍 Why It Works
Institutions build and unwind positions around VWAP.
Retail often chases volume… this script shows you when that volume becomes too extreme.
A spike above VWAP near resistance? → Likely distribution.
A spike below VWAP near support? → Likely capitulation.
Combine volume exhaustion + VWAP context, and you’ll see market turning points form before most indicators react.
⚙️ Inputs You Can Tune
Bands lookback: adjusts how reactive the VWAP bands are
Band width (σ): set how tight or wide your deviation envelope is
Volume baseline length: controls how “abnormal” a spike must be
Spike threshold: multiplier vs. average volume
Toggle color-coding, bands, and labels
Default settings work well across 1m–15m intraday charts and 1h–4h swing frames.
💡 How Traders Use It
1️⃣ Fade Parabolics:
When a green spike candle pierces upper VWAP band on high volume → smart money unloading.
Look for rejection and short into VWAP.
2️⃣ Catch Capitulations:
When a red spike candle dumps below lower VWAP band → panic selling.
Watch for stabilization and long back to VWAP.
3️⃣ VWAP Rotation Plays:
Alerts for price crossing VWAP help you spot shift in intraday control.
Above VWAP = buyers in charge.
Below VWAP = sellers in charge.
🧠 Best Practices
Pair it with Volume Profile or Delta/Flow tools to confirm exhaustion.
Don’t chase — wait for spike confirmation + reversal candle.
Use it on liquid tickers (NASDAQ, SPY, GOLD, BTC, etc.).
Great for Dux-style small-cap shorts or index pullbacks.
🔔 Alerts Ready
Choose from:
Volume Spike (single-bar explosion)
VWAP Cross Up/Down (trend shift confirmation)
One Combined Alert (any signal, includes ticker, price, and volume)
Set once — get real-time push notifications, Telegram, or webhook signals.
📊 My Favorite Setups
US100 / NASDAQ: fade rallies above VWAP + spike
Gold / Silver: trade reversals from VWAP bands
Small caps: short back-side after volume climax
ES, DAX, Oil: scalp VWAP rotation with confluence
❤️ Support This Work
I release free and premium scripts weekly — combining smart money concepts, VWAP tools, and volume analytics.
👉 Follow me on TradingView for more indicators and setups.
👉 Comment “🔥” if you want me to post the multi-timeframe VWAP + Volume Pressure version next.
👉 Share this with your team — it helps the community grow.

Algorithm Predator - ML-liteAlgorithm Predator - ML-lite
This indicator combines four specialized trading agents with an adaptive multi-armed bandit selection system to identify high-probability trade setups. It is designed for swing and intraday traders who want systematic signal generation based on institutional order flow patterns , momentum exhaustion , liquidity dynamics , and statistical mean reversion .
Core Architecture
Why These Components Are Combined:
The script addresses a fundamental challenge in algorithmic trading: no single detection method works consistently across all market conditions. By deploying four independent agents and using reinforcement learning algorithms to select or blend their outputs, the system adapts to changing market regimes without manual intervention.
The Four Trading Agents
1. Spoofing Detector Agent 🎭
Detects iceberg orders through persistent volume at similar price levels over 5 bars
Identifies spoofing patterns via asymmetric wick analysis (wicks exceeding 60% of bar range with volume >1.8× average)
Monitors order clustering using simplified Hawkes process intensity tracking (exponential decay model)
Signal Logic: Contrarian—fades false breakouts caused by institutional manipulation
Best Markets: Consolidations, institutional trading windows, low-liquidity hours
2. Exhaustion Detector Agent ⚡
Calculates RSI divergence between price movement and momentum indicator over 5-bar window
Detects VWAP exhaustion (price at 2σ bands with declining volume)
Uses VPIN reversals (volume-based toxic flow dissipation) to identify momentum failure
Signal Logic: Counter-trend—enters when momentum extreme shows weakness
Best Markets: Trending markets reaching climax points, over-extended moves
3. Liquidity Void Detector Agent 💧
Measures Bollinger Band squeeze (width <60% of 50-period average)
Identifies stop hunts via 20-bar high/low penetration with immediate reversal and volume spike
Detects hidden liquidity absorption (volume >2× average with range <0.3× ATR)
Signal Logic: Breakout anticipation—enters after liquidity grab but before main move
Best Markets: Range-bound pre-breakout, volatility compression zones
4. Mean Reversion Agent 📊
Calculates price z-scores relative to 50-period SMA and standard deviation (triggers at ±2σ)
Implements Ornstein-Uhlenbeck process scoring (mean-reverting stochastic model)
Uses entropy analysis to detect algorithmic trading patterns (low entropy <0.25 = high predictability)
Signal Logic: Statistical reversion—enters when price deviates significantly from statistical equilibrium
Best Markets: Range-bound, low-volatility, algorithmically-dominated instruments
Adaptive Selection: Multi-Armed Bandit System
The script implements four reinforcement learning algorithms to dynamically select or blend agents based on performance:
Thompson Sampling (Default - Recommended):
Uses Bayesian inference with beta distributions (tracks alpha/beta parameters per agent)
Balances exploration (trying underused agents) vs. exploitation (using proven winners)
Each agent's win/loss history informs its selection probability
Lite Approximation: Uses pseudo-random sampling from price/volume noise instead of true random number generation
UCB1 (Upper Confidence Bound):
Calculates confidence intervals using: average_reward + sqrt(2 × ln(total_pulls) / agent_pulls)
Deterministic algorithm favoring agents with high uncertainty (potential upside)
More conservative than Thompson Sampling
Epsilon-Greedy:
Exploits best-performing agent (1-ε)% of the time
Explores randomly ε% of the time (default 10%, configurable 1-50%)
Simple, transparent, easily tuned via epsilon parameter
Gradient Bandit:
Uses softmax probability distribution over agent preference weights
Updates weights via gradient ascent based on rewards
Best for Blend mode where all agents contribute
Selection Modes:
Switch Mode: Uses only the selected agent's signal (clean, decisive)
Blend Mode: Combines all agents using exponentially weighted confidence scores controlled by temperature parameter (smooth, diversified)
Lock Agent Feature:
Optional manual override to force one specific agent
Useful after identifying which agent dominates your specific instrument
Only applies in Switch mode
Four choices: Spoofing Detector, Exhaustion Detector, Liquidity Void, Mean Reversion
Memory System
Dual-Layer Architecture:
Short-Term Memory: Stores last 20 trade outcomes per agent (configurable 10-50)
Long-Term Memory: Stores episode averages when short-term reaches transfer threshold (configurable 5-20 bars)
Memory Boost Mechanism: Recent performance modulates agent scores by up to ±20%
Episode Transfer: When an agent accumulates sufficient results, averages are condensed into long-term storage
Persistence: Manual restoration of learned parameters via input fields (alpha, beta, weights, microstructure thresholds)
How Memory Works:
Agent generates signal → outcome tracked after 8 bars (performance horizon)
Result stored in short-term memory (win = 1.0, loss = 0.0)
Short-term average influences agent's future scores (positive feedback loop)
After threshold met (default 10 results), episode averaged into long-term storage
Long-term patterns (weighted 30%) + short-term patterns (weighted 70%) = total memory boost
Market Microstructure Analysis
These advanced metrics quantify institutional order flow dynamics:
Order Flow Toxicity (Simplified VPIN):
Measures buy/sell volume imbalance over 20 bars: |buy_vol - sell_vol| / (buy_vol + sell_vol)
Detects informed trading activity (institutional players with non-public information)
Values >0.4 indicate "toxic flow" (informed traders active)
Lite Approximation: Uses simple open/close heuristic instead of tick-by-tick trade classification
Price Impact Analysis (Simplified Kyle's Lambda):
Measures market impact efficiency: |price_change_10| / sqrt(volume_sum_10)
Low values = large orders with minimal price impact ( stealth accumulation )
High values = retail-dominated moves with high slippage
Lite Approximation: Uses simplified denominator instead of regression-based signed order flow
Market Randomness (Entropy Analysis):
Counts unique price changes over 20 bars / 20
Measures market predictability
High entropy (>0.6) = human-driven, chaotic price action
Low entropy (<0.25) = algorithmic trading dominance (predictable patterns)
Lite Approximation: Simple ratio instead of true Shannon entropy H(X) = -Σ p(x)·log₂(p(x))
Order Clustering (Simplified Hawkes Process):
Tracks self-exciting event intensity (coordinated order activity)
Decays at 0.9× per bar, spikes +1.0 when volume >1.5× average
High intensity (>0.7) indicates clustering (potential spoofing/accumulation)
Lite Approximation: Simple exponential decay instead of full λ(t) = μ + Σ α·exp(-β(t-tᵢ)) with MLE
Signal Generation Process
Multi-Stage Validation:
Stage 1: Agent Scoring
Each agent calculates internal score based on its detection criteria
Scores must exceed agent-specific threshold (adjusted by sensitivity multiplier)
Agent outputs: Signal direction (+1/-1/0) and Confidence level (0.0-1.0)
Stage 2: Memory Boost
Agent scores multiplied by memory boost factor (0.8-1.2 based on recent performance)
Successful agents get amplified, failing agents get dampened
Stage 3: Bandit Selection/Blending
If Adaptive Mode ON:
Switch: Bandit selects single best agent, uses only its signal
Blend: All agents combined using softmax-weighted confidence scores
If Adaptive Mode OFF:
Traditional consensus voting with confidence-squared weighting
Signal fires when consensus exceeds threshold (default 70%)
Stage 4: Confirmation Filter
Raw signal must repeat for consecutive bars (default 3, configurable 2-4)
Minimum confidence threshold: 0.25 (25%) enforced regardless of mode
Trend alignment check: Long signals require trend_score ≥ -2, Short signals require trend_score ≤ 2
Stage 5: Cooldown Enforcement
Minimum bars between signals (default 10, configurable 5-15)
Prevents over-trading during choppy conditions
Stage 6: Performance Tracking
After 8 bars (performance horizon), signal outcome evaluated
Win = price moved in signal direction, Loss = price moved against
Results fed back into memory and bandit statistics
Trading Modes (Presets)
Pre-configured parameter sets:
Conservative: 85% consensus, 4 confirmations, 15-bar cooldown
Expected: 60-70% win rate, 3-8 signals/week
Best for: Swing trading, capital preservation, beginners
Balanced: 70% consensus, 3 confirmations, 10-bar cooldown
Expected: 55-65% win rate, 8-15 signals/week
Best for: Day trading, most traders, general use
Aggressive: 60% consensus, 2 confirmations, 5-bar cooldown
Expected: 50-58% win rate, 15-30 signals/week
Best for: Scalping, high-frequency trading, active management
Elite: 75% consensus, 3 confirmations, 12-bar cooldown
Expected: 58-68% win rate, 5-12 signals/week
Best for: Selective trading, high-conviction setups
Adaptive: 65% consensus, 2 confirmations, 8-bar cooldown
Expected: Varies based on learning
Best for: Experienced users leveraging bandit system
How to Use
1. Initial Setup (5 Minutes):
Select Trading Mode matching your style (start with Balanced)
Enable Adaptive Learning (recommended for automatic agent selection)
Choose Thompson Sampling algorithm (best all-around performance)
Keep Microstructure Metrics enabled for liquid instruments (>100k daily volume)
2. Agent Tuning (Optional):
Adjust Agent Sensitivity multipliers (0.5-2.0):
<0.8 = Highly selective (fewer signals, higher quality)
0.9-1.2 = Balanced (recommended starting point)
1.3 = Aggressive (more signals, lower individual quality)
Monitor dashboard for 20-30 signals to identify dominant agent
If one agent consistently outperforms, consider using Lock Agent feature
3. Bandit Configuration (Advanced):
Blend Temperature (0.1-2.0):
0.3 = Sharp decisions (best agent dominates)
0.5 = Balanced (default)
1.0+ = Smooth (equal weighting, democratic)
Memory Decay (0.8-0.99):
0.90 = Fast adaptation (volatile markets)
0.95 = Balanced (most instruments)
0.97+ = Long memory (stable trends)
4. Signal Interpretation:
Green triangle (▲): Long signal confirmed
Red triangle (▼): Short signal confirmed
Dashboard shows:
Active agent (highlighted row with ► marker)
Win rate per agent (green >60%, yellow 40-60%, red <40%)
Confidence bars (█████ = maximum confidence)
Memory size (short-term buffer count)
Colored zones display:
Entry level (current close)
Stop-loss (1.5× ATR)
Take-profit 1 (2.0× ATR)
Take-profit 2 (3.5× ATR)
5. Risk Management:
Never risk >1-2% per signal (use ATR-based stops)
Signals are entry triggers, not complete strategies
Combine with your own market context analysis
Consider fundamental catalysts and news events
Use "Confirming" status to prepare entries (not to enter early)
6. Memory Persistence (Optional):
After 50-100 trades, check Memory Export Panel
Record displayed alpha/beta/weight values for each agent
Record VPIN and Kyle threshold values
Enable "Restore From Memory" and input saved values to continue learning
Useful when switching timeframes or restarting indicator
Visual Components
On-Chart Elements:
Spectral Layers: EMA8 ± 0.5 ATR bands (dynamic support/resistance, colored by trend)
Energy Radiance: Multi-layer glow boxes at signal points (intensity scales with confidence, configurable 1-5 layers)
Probability Cones: Projected price paths with uncertainty wedges (15-bar projection, width = confidence × ATR)
Connection Lines: Links sequential signals (solid = same direction continuation, dotted = reversal)
Kill Zones: Risk/reward boxes showing entry, stop-loss, and dual take-profit targets
Signal Markers: Triangle up/down at validated entry points
Dashboard (Configurable Position & Size):
Regime Indicator: 4-level trend classification (Strong Bull/Bear, Weak Bull/Bear)
Mode Status: Shows active system (Adaptive Blend, Locked Agent, or Consensus)
Agent Performance Table: Real-time win%, confidence, and memory stats
Order Flow Metrics: Toxicity and impact indicators (when microstructure enabled)
Signal Status: Current state (Long/Short/Confirming/Waiting) with confirmation progress
Memory Panel (Configurable Position & Size):
Live Parameter Export: Alpha, beta, and weight values per agent
Adaptive Thresholds: Current VPIN sensitivity and Kyle threshold
Save Reminder: Visual indicator if parameters should be recorded
What Makes This Original
This script's originality lies in three key innovations:
1. Genuine Meta-Learning Framework:
Unlike traditional indicator mashups that simply display multiple signals, this implements authentic reinforcement learning (multi-armed bandits) to learn which detection method works best in current conditions. The Thompson Sampling implementation with beta distribution tracking (alpha for successes, beta for failures) is statistically rigorous and adapts continuously. This is not post-hoc optimization—it's real-time learning.
2. Episodic Memory Architecture with Transfer Learning:
The dual-layer memory system mimics human learning patterns:
Short-term memory captures recent performance (recency bias)
Long-term memory preserves historical patterns (experience)
Automatic transfer mechanism consolidates knowledge
Memory boost creates positive feedback loops (successful strategies become stronger)
This architecture allows the system to adapt without retraining , unlike static ML models that require batch updates.
3. Institutional Microstructure Integration:
Combines retail-focused technical analysis (RSI, Bollinger Bands, VWAP) with institutional-grade microstructure metrics (VPIN, Kyle's Lambda, Hawkes processes) typically found in academic finance literature and professional trading systems, not standard retail platforms. While simplified for Pine Script constraints, these metrics provide insight into informed vs. uninformed trading , a dimension entirely absent from traditional technical analysis.
Mashup Justification:
The four agents are combined specifically for risk diversification across failure modes:
Spoofing Detector: Prevents false breakout losses from manipulation
Exhaustion Detector: Prevents chasing extended trends into reversals
Liquidity Void: Exploits volatility compression (different regime than trending)
Mean Reversion: Provides mathematical anchoring when patterns fail
The bandit system ensures the optimal tool is automatically selected for each market situation, rather than requiring manual interpretation of conflicting signals.
Why "ML-lite"? Simplifications and Approximations
This is the "lite" version due to necessary simplifications for Pine Script execution:
1. Simplified VPIN Calculation:
Academic Implementation: True VPIN uses volume bucketing (fixed-volume bars) and tick-by-tick buy/sell classification via Lee-Ready algorithm or exchange-provided trade direction flags
This Implementation: 20-bar rolling window with simple open/close heuristic (close > open = buy volume)
Impact: May misclassify volume during ranging/choppy markets; works best in directional moves
2. Pseudo-Random Sampling:
Academic Implementation: Thompson Sampling requires true random number generation from beta distributions using inverse transform sampling or acceptance-rejection methods
This Implementation: Deterministic pseudo-randomness derived from price and volume decimal digits: (close × 100 - floor(close × 100)) + (volume % 100) / 100
Impact: Not cryptographically random; may have subtle biases in specific price ranges; provides sufficient variation for agent selection
3. Hawkes Process Approximation:
Academic Implementation: Full Hawkes process uses maximum likelihood estimation with exponential kernels: λ(t) = μ + Σ α·exp(-β(t-tᵢ)) fitted via iterative optimization
This Implementation: Simple exponential decay (0.9 multiplier) with binary event triggers (volume spike = event)
Impact: Captures self-exciting property but lacks parameter optimization; fixed decay rate may not suit all instruments
4. Kyle's Lambda Simplification:
Academic Implementation: Estimated via regression of price impact on signed order flow over multiple time intervals: Δp = λ × Δv + ε
This Implementation: Simplified ratio: price_change / sqrt(volume_sum) without proper signed order flow or regression
Impact: Provides directional indicator of impact but not true market depth measurement; no statistical confidence intervals
5. Entropy Calculation:
Academic Implementation: True Shannon entropy requires probability distribution: H(X) = -Σ p(x)·log₂(p(x)) where p(x) is probability of each price change magnitude
This Implementation: Simple ratio of unique price changes to total observations (variety measure)
Impact: Measures diversity but not true information entropy with probability weighting; less sensitive to distribution shape
6. Memory System Constraints:
Full ML Implementation: Neural networks with backpropagation, experience replay buffers (storing state-action-reward tuples), gradient descent optimization, and eligibility traces
This Implementation: Fixed-size array queues with simple averaging; no gradient-based learning, no state representation beyond raw scores
Impact: Cannot learn complex non-linear patterns; limited to linear performance tracking
7. Limited Feature Engineering:
Advanced Implementation: Dozens of engineered features, polynomial interactions (x², x³), dimensionality reduction (PCA, autoencoders), feature selection algorithms
This Implementation: Raw agent scores and basic market metrics (RSI, ATR, volume ratio); minimal transformation
Impact: May miss subtle cross-feature interactions; relies on agent-level intelligence rather than feature combinations
8. Single-Instrument Data:
Full Implementation: Multi-asset correlation analysis (sector ETFs, currency pairs, volatility indices like VIX), lead-lag relationships, risk-on/risk-off regimes
This Implementation: Only OHLCV data from displayed instrument
Impact: Cannot incorporate broader market context; vulnerable to correlated moves across assets
9. Fixed Performance Horizon:
Full Implementation: Adaptive horizon based on trade duration, volatility regime, or profit target achievement
This Implementation: Fixed 8-bar evaluation window
Impact: May evaluate too early in slow markets or too late in fast markets; one-size-fits-all approach
Performance Impact Summary:
These simplifications make the script:
✅ Faster: Executes in milliseconds vs. seconds (or minutes) for full academic implementations
✅ More Accessible: Runs on any TradingView plan without external data feeds, APIs, or compute servers
✅ More Transparent: All calculations visible in Pine Script (no black-box compiled models)
✅ Lower Resource Usage: <500 bars lookback, minimal memory footprint
⚠️ Less Precise: Approximations may reduce statistical edge by 5-15% vs. academic implementations
⚠️ Limited Scope: Cannot capture tick-level dynamics, multi-order-book interactions, or cross-asset flows
⚠️ Fixed Parameters: Some thresholds hardcoded rather than dynamically optimized
When to Upgrade to Full Implementation:
Consider professional Python/C++ versions with institutional data feeds if:
Trading with >$100K capital where precision differences materially impact returns
Operating in microsecond-competitive environments (HFT, market making)
Requiring regulatory-grade audit trails and reproducibility
Backtesting with tick-level precision for strategy validation
Need true real-time adaptation with neural network-based learning
For retail swing/day trading and position management, these approximations provide sufficient signal quality while maintaining usability, transparency, and accessibility. The core logic—multi-agent detection with adaptive selection—remains intact.
Technical Notes
All calculations use standard Pine Script built-in functions ( ta.ema, ta.atr, ta.rsi, ta.bb, ta.sma, ta.stdev, ta.vwap )
VPIN and Kyle's Lambda use simplified formulas optimized for OHLCV data (see "Lite" section above)
Thompson Sampling uses pseudo-random noise from price/volume decimal digits for beta distribution sampling
No repainting: All calculations use confirmed bar data (no forward-looking)
Maximum lookback: 500 bars (set via max_bars_back parameter)
Performance evaluation: 8-bar forward-looking window for reward calculation (clearly disclosed)
Confidence threshold: Minimum 0.25 (25%) enforced on all signals
Memory arrays: Dynamic sizing with FIFO queue management
Limitations and Disclaimers
Not Predictive: This indicator identifies patterns in historical data. It cannot predict future price movements with certainty.
Requires Human Judgment: Signals are entry triggers, not complete trading strategies. Must be confirmed with your own analysis, risk management rules, and market context.
Learning Period Required: The adaptive system requires 50-100 bars minimum to build statistically meaningful performance data for bandit algorithms.
Overfitting Risk: Restoring memory parameters from one market regime to a drastically different regime (e.g., low volatility to high volatility) may cause poor initial performance until system re-adapts.
Approximation Limitations: Simplified calculations (see "Lite" section) may underperform academic implementations by 5-15% in highly efficient markets.
No Guarantee of Profit: Past performance, whether backtested or live-traded, does not guarantee future performance. All trading involves risk of loss.
Forward-Looking Bias: Performance evaluation uses 8-bar forward window—this creates slight look-ahead for learning (though not for signals). Real-time performance may differ from indicator's internal statistics.
Single-Instrument Limitation: Does not account for correlations with related assets or broader market regime changes.
Recommended Settings
Timeframe: 15-minute to 4-hour charts (sufficient volatility for ATR-based stops; adequate bar volume for learning)
Assets: Liquid instruments with >100k daily volume (forex majors, large-cap stocks, BTC/ETH, major indices)
Not Recommended: Illiquid small-caps, penny stocks, low-volume altcoins (microstructure metrics unreliable)
Complementary Tools: Volume profile, order book depth, market breadth indicators, fundamental catalysts
Position Sizing: Risk no more than 1-2% of capital per signal using ATR-based stop-loss
Signal Filtering: Consider external confluence (support/resistance, trendlines, round numbers, session opens)
Start With: Balanced mode, Thompson Sampling, Blend mode, default agent sensitivities (1.0)
After 30+ Signals: Review agent win rates, consider increasing sensitivity of top performers or locking to dominant agent
Alert Configuration
The script includes built-in alert conditions:
Long Signal: Fires when validated long entry confirmed
Short Signal: Fires when validated short entry confirmed
Alerts fire once per bar (after confirmation requirements met)
Set alert to "Once Per Bar Close" for reliability
Taking you to school. — Dskyz, Trade with insight. Trade with anticipation.

Force DashboardScalping Dashboard - Complete User Guide
Overview
This scalping system consists of two complementary TradingView indicators designed for intraday trading with no overnight holds:
Force Dashboard - Single-row table showing real-time market bias and entry signals
Large Order Detection - Visual diamonds showing institutional order flow
Together, they provide a complete at-a-glance view of market conditions optimized for quick entries and exits.
Recommended Timeframes
Primary Scalping Timeframes
1-minute chart: Ultra-fast scalps (30 seconds - 3 minutes hold time)
2-minute chart: Quick scalps (2-5 minutes hold time)
5-minute chart: Standard scalps (5-15 minutes hold time)
Best Practices
Use 1-2 minute for highly liquid instruments (ES, NQ, major forex pairs)
Use 5-minute for less liquid markets or if you prefer fewer signals
Never hold past the last hour of trading to avoid overnight risk
Set hard stop times (e.g., exit all positions by 3:45 PM EST)
Dashboard Components Explained
Core Indicators (Circles ●)
MACD (5/13/5)
Green ● = Bullish momentum (MACD histogram positive)
Red ● = Bearish momentum (MACD histogram negative)
Gray ● = No clear momentum
Use: Confirms trend direction and momentum shifts
EMA (9/20/50)
Green ● = Price > EMA9 > EMA20 (uptrend)
Red ● = Price < EMA9 < EMA20 (downtrend)
Gray ● = Choppy/sideways
Use: Identifies the immediate micro-trend
Stoch (5-period Stochastic)
Green ● = Oversold (<20) - potential reversal up
Red ● = Overbought (>80) - potential reversal down
Gray ● = Neutral zone (20-80)
Use: Spots reversal opportunities at extremes
RSI (7-period)
Green ● = Oversold (<30)
Red ● = Overbought (>70)
Gray ● = Neutral
Use: Confirms overbought/oversold conditions
CVD (Cumulative Volume Delta)
Green ● = CVD above its moving average (buying pressure)
Red ● = CVD below its moving average (selling pressure)
Gray ● = Neutral
Use: Shows overall buying vs selling pressure
ΔCVD (Delta CVD - Rate of Change)
Green ● = CVD accelerating upward (buying acceleration)
Red ● = CVD accelerating downward (selling acceleration)
Gray ● = No acceleration
Use: Detects momentum shifts in order flow
Imbal (Order Flow Imbalance)
Green ● = Buy pressure >2x sell pressure
Red ● = Sell pressure >2x buy pressure
Gray ● = Balanced
Use: Identifies extreme one-sided order flow
Vol (Volume Strength)
Green ● = Volume >1.5x average (strong interest)
Red ● = Volume <0.7x average (low interest)
Gray ● = Normal volume
Yellow background = Volume surge (>2x average) - BIG MOVE ALERT
Use: Confirms conviction behind price moves
Tape (Tape Speed)
Green ● = Fast order flow (>1.3x normal)
Red ● = Slow order flow (<0.7x normal)
Gray ● = Normal speed
Yellow background = Very fast tape (>1.5x) - RAPID EXECUTION ALERT
Use: Measures urgency and speed of orders
Key Levels
Support (Supp)
Shows the nearest high-volume support level below current price
Bright Green background = Price is AT support (within 0.3%) - BOUNCE ZONE
Green background = Price above support (healthy)
Red background = Price below support (broken support, now resistance)
Resistance (Res)
Shows the nearest high-volume resistance level above current price
Bright Orange background = Price is AT resistance (within 0.3%) - REJECTION ZONE
Red background = Price below resistance (facing overhead supply)
Green background = Price above resistance (breakout)
These levels update automatically every 3 bars based on volume profile
Entry Signal Components
Score
Displays format: "6L" (6 long indicators) or "4S" (4 short indicators)
Bright Green = 6-7 indicators aligned for long
Light Green = 5 indicators aligned for long
Yellow = 4 indicators aligned (weaker setup)
Gray = No alignment
Red/Orange colors = Same scale for short setups
Score of 5+ indicates high-probability setup
SCALP (Main Entry Signal)
BRIGHT GREEN "LONG" = High-quality long scalp (Score 5+)
Green "LONG" = Decent long scalp (Score 4)
BRIGHT ORANGE "SHORT" = High-quality short scalp (Score 5+)
Red "SHORT" = Decent short scalp (Score 4)
Gray "WAIT" = No clear setup - STAY OUT
Entry Strategies
Strategy 1: High-Probability Scalps (Conservative)
When to Enter:
SCALP column shows BRIGHT GREEN "LONG" or BRIGHT ORANGE "SHORT"
Score is 5 or higher
Vol or Tape has yellow background (volume surge)
Example Long Setup:
SCALP = BRIGHT GREEN "LONG"
Score = 6L
Vol = Yellow background
Price AT Support (bright green Supp cell)
EMA, MACD, CVD, ΔCVD, Imbal all green
Entry: Enter immediately on next candle
Target: 0.5-1% move or resistance level
Stop: Below support or -0.3%
Hold Time: 2-10 minutes
Strategy 2: Momentum Scalps (Aggressive)
When to Enter:
Tape has yellow background (fast tape)
Vol has yellow background (volume surge)
ΔCVD is green (for longs) or red (for shorts)
Imbal shows strong imbalance in your direction
Score is 4+
Example Short Setup:
Tape & Vol = Yellow backgrounds
ΔCVD = Red, Imbal = Red
Price AT Resistance (bright orange)
Score = 5S
Entry: Enter immediately
Target: Quick 0.3-0.7% move
Stop: Tight -0.2%
Hold Time: 1-5 minutes
Strategy 3: Reversal Scalps (Mean Reversion)
When to Enter:
Stoch shows oversold (green) or overbought (red)
RSI confirms the extreme
Price is AT Support (for longs) or AT Resistance (for shorts)
ΔCVD and Imbal start reversing direction
Score is 4+
Example Long Setup:
Stoch = Green (oversold)
RSI = Green (oversold)
Supp = Bright green (at support)
ΔCVD turns green
Imbal turns green
Score = 4L or 5L
Entry: Wait for confirmation candle
Target: Move back to EMA9 or mid-range
Stop: Below the low
Hold Time: 3-8 minutes
Large Order Detection Usage
Diamond Signals
Green diamonds below bar = Large buy orders (institutional buying)
Red diamonds above bar = Large sell orders (institutional selling)
Size matters: Larger diamonds = larger order flow
How to Use with Dashboard
Confirmation Entries
Dashboard shows "LONG" signal
Green diamond appears
Enter immediately - institutions are buying
Divergence Alerts (CAUTION)
Dashboard shows "LONG" signal
RED diamond appears (institutions selling)
DO NOT ENTER - conflicting order flow
Cluster Patterns
Multiple green diamonds in row = Strong accumulation, stay long
Multiple red diamonds in row = Strong distribution, stay short
Alternating colors = Chop, avoid trading
Risk Management Rules
Position Sizing
Risk 0.5-1% of account per scalp
Maximum 3 concurrent positions
Reduce size after 2 consecutive losses
Stop Loss Guidelines
Tight stops: 0.2-0.3% for 1-2 min charts
Standard stops: 0.3-0.5% for 5 min charts
Always use stop loss - no exceptions
Place stops below support (longs) or above resistance (shorts)
Take Profit Targets
Target 1: 0.3-0.5% (take 50% off)
Target 2: 0.7-1% (take remaining 50%)
Move stop to breakeven after Target 1 hit
Trail stop if Score remains high
Time-Based Exits
Exit immediately if:
SCALP changes from LONG/SHORT to WAIT
Score drops below 3
Large diamond appears in opposite direction
Maximum hold time: 15 minutes (even if profitable)
Hard exit time: 30 minutes before market close
Trading Sessions
Best Times to Scalp
High-Liquidity Sessions
9:30-11:00 AM EST (Market open, highest volume)
2:00-3:30 PM EST (Afternoon session, good moves)
Avoid
11:30 AM-1:30 PM EST (Lunch, low volume)
Last 30 minutes (unpredictable, don't initiate new trades)
News releases (wait 5 minutes for volatility to settle)
Common Patterns & Setups
The Perfect Storm (Highest Probability)
Score = 6L or 7L
SCALP = BRIGHT GREEN
Vol + Tape = Yellow backgrounds
Green diamond appears
Price AT Support
Win rate: ~70-80%
The Fade Setup (Counter-Trend)
Price hits resistance (bright orange)
Stoch + RSI overbought (red)
Red diamond appears
CVD starts turning red
SCALP shows "SHORT"
Win rate: ~60-70%
The Breakout Continuation
Price breaks resistance (Res turns green)
EMA, MACD green
Vol surge (yellow)
Multiple green diamonds
SCALP = "LONG"
Win rate: ~65-75%
Warning Signs - DO NOT TRADE
Red Flags
❌ SCALP shows "WAIT"
❌ Score below 3
❌ Vol and Tape both gray (no volume)
❌ Conflicting signals (dashboard says LONG but red diamonds appearing)
❌ Alternating green/red circles (choppy market)
❌ Support and Resistance very close together (tight range)
Market Conditions to Avoid
Low volume periods
Major news releases (first 5 minutes after)
First 2 minutes after market open
Wide spreads
Consecutive losing trades (take a break after 2 losses)
Quick Reference Checklist
Before Taking ANY Trade:
☑ SCALP shows LONG or SHORT (not WAIT)
☑ Score is 4 or higher
☑ Vol or Tape shows activity
☑ No conflicting diamond signals
☑ Stop loss level identified
☑ Target profit level identified
☑ Not in restricted time periods
After Entering:
☑ Set stop loss immediately
☑ Set profit targets
☑ Watch SCALP column - exit if changes to WAIT
☑ Watch for opposite-colored diamonds
☑ Move stop to breakeven after first target
☑ Exit all by market close
Advanced Tips
Scalping Psychology
Be patient: Wait for Score 5+ setups
Be decisive: When signal appears, act immediately
Be disciplined: Follow your stop loss always
Be flexible: Exit quickly if dashboard reverses
Optimization
Backtest on your specific instrument
Adjust RSI/Stoch levels for your market
Fine-tune volume thresholds
Keep a trade journal to track which setups work best
Multi-Timeframe Confirmation
Use 5-min dashboard as "trend filter"
Take 1-min trades only in direction of 5-min SCALP signal
Increases win rate by ~10-15%
Troubleshooting
Q: Dashboard shows WAIT most of the time
Normal - scalping is about patience. Quality > Quantity
3-8 good setups per day is excellent
Q: Too many false signals
Increase minimum Score requirement to 5 or 6
Only trade with volume surge (yellow backgrounds)
Add large order detection confirmation
Q: Signals too slow
You may be on too high a timeframe
Try 1-minute chart for faster signals
Ensure real-time data feed is active
Q: Support/Resistance not updating
Normal - updates every 3 bars
If completely stuck, remove and re-add indicator
Summary
This scalping system works best when:
✅ Multiple indicators align (Score 5+)
✅ Volume and tape speed confirm the move
✅ Order flow (diamonds) confirms direction
✅ Price is at key levels (support/resistance)
✅ You manage risk strictly
✅ You exit before market close
The golden rule: When SCALP says WAIT, you WAIT. Discipline beats frequency.

1BullBear™ StatisticsOverview
1BullBear™ Statistics is a comprehensive volume delta analysis tool that transforms raw order flow data into actionable visual insights. This indicator displays seven key metrics in a clean, gradient-based heatmap format below your price chart, helping you identify significant buying and selling pressure in real-time.
Key Features: Seven Essential Metrics
Volume - Total volume per bar with threshold highlighting
Delta - Net buying/selling pressure (Buy Volume - Sell Volume)
Cumulative Delta - Session-based running total of delta
Delta Ratio - Delta expressed as a percentage of total volume
Minimum - Lowest delta value within the bar's timeframe
Maximum - Highest delta value within the bar's timeframe
Standard Deviation - Statistical measure of delta volatility within the session
Intelligent Gradient Visualization
Dynamic color intensity based on historical significance
Adaptive scaling using configurable lookback periods (10-200 bars)
Threshold-based highlighting to immediately spot extreme values
Separate bull/bear coloring for directional clarity
Customizable transparency for optimal chart integration
Flexible Configuration
Toggle any metric on/off to focus on what matters
Custom labels - rename metrics to your preference
Independent color schemes for each row
Adjustable thresholds for highlighting significant values
Multiple text sizes from tiny to huge
Session-aware calculations that reset at market open
Real-Time Updates
Confirmed bars display permanent historical data
Current bar updates in real-time as price action develops
Efficient rendering with automatic cleanup of previous bars
Handles up to 500 boxes for extensive historical analysis
How It Works
The indicator uses TradingView's native volume delta data (sourced from lower timeframe aggregation) to calculate order flow statistics. Each metric is displayed as a colored box below the chart, with gradient intensity representing the value's significance relative to recent history.
Gradient Logic:
Stronger colors = more significant values relative to the lookback period
Transparent backgrounds = values below threshold (filtered out)
Color saturation scales from 0% to your set maximum opacity
Session Management:
Cumulative Delta and Standard Deviation reset at each new trading session
Session detection uses exchange timezone for accurate daily calculations
Historical lookback maintains a rolling window for gradient intensity
I deal Use Cases
Scalping & Day Trading - Identify aggressive buying/selling in real-time
Order Flow Analysis - Understand market participant behavior
Divergence Detection - Spot when price and delta disagree
Volume Profile Context - Complement VP analysis with granular delta data
Breakout Confirmation - Verify price moves with volume delta agreement
Default Thresholds
The indicator comes pre-configured with sensible defaults for futures trading:
Volume: Highlights bars above 1,500 contracts
Delta: Flags extremes beyond ±500
Delta Ratio: Alerts on imbalances beyond ±70%
Min/Max: Range filter of ±10 for precision
Std Dev: Highlights outliers beyond ±0.7 standard deviations
Adjust these values based on your instrument and timeframe.
Technical Notes
Requires real-time volume delta data from your broker
Works best on instruments with strong volume (futures, major stocks, crypto)
Lower timeframe aggregation defaults to 1-second or 1-minute depending on chart timeframe
Optimized performance with efficient array management and conditional rendering
Compatibility
Pine Script™ v6
All timeframes supported
Best results on liquid instruments with reliable volume data
Integrates seamlessly with other TradingView indicators
Created by KweeBoss_ | Licensed under Mozilla Public License 2.0
Note: This indicator analyzes historical and real-time volume data. Past performance does not guarantee future results. Always combine with other forms of analysis and proper risk management.

STWP Unified EMA Band (HLC Fusion – Crossover Enhanced Edition)🧠 STWP Unified EMA Band (HLC Fusion – Crossover Enhanced Edition)
Author: simpletradewithpatience (STWP)
Markets: Equities, Indices & Futures
Best Timeframes: 5-min to 1-hour (Daily TF optional for broader trend observation)
Built With: Pine Script v5
A structured, educational EMA fusion framework designed to help traders visually study trend transitions, slope behavior, and volume-based momentum shifts.
📌 Overview
The STWP Unified EMA Band merges High–Low–Close fusion logic with crossover detection and volume context to offer a clear visual understanding of trend behavior.
It is designed for traders who want to observe trend transitions, analyze momentum health, and study how volume supports or contradicts directional bias.
Internally, it uses an optimized EMA 9–21 fusion structure to identify directional shifts with precision and stability — a balance developed through the STWP methodology for consistent, unbiased trend evaluation.
This enhanced edition introduces a Crossover Engine for smoother transitions, adaptive band coloring, and a real-time educational dashboard that provides instant feedback on trend and volume strength.
📸 Chart Previews (Educational Examples)
1️⃣ Bullish Momentum Phase
🔗
📈 A bullish crossover where the fast EMA overtakes the slow EMA.
Observe the slope steepening and the dashboard confirming trend expansion.
2️⃣ Bearish Momentum Phase
🔗
📉 Displays a bearish crossover with slope weakening and band compression.
The dashboard highlights a transition to bearish bias with corresponding volume context.
⚠️ Snapshots are for educational reference only — not trading signals or recommendations.
📌 Key Features
✅ Dual EMA Band using High–Low–Close fusion logic
✅ Dynamic bullish/bearish band coloring
✅ Mid-band slope indicator with momentum feedback
✅ Volume strength classification (Strong / Moderate / Weak)
✅ Contextual crossover labels with real-time commentary
✅ Auto-removable exit labels for clean visualization
✅ Built-in educational STWP Dashboard (trend, slope, and volume insights)
✅ User-customizable color palette and toggles
✅ Compatible across intraday and swing setups
📊 STWP Dashboard Summary
A compact real-time data panel offering:
📈 Trend Status: Bullish / Bearish / Neutral
📊 Volume Condition: Strong / Moderate / Low
📉 Slope Direction: Rising / Falling / Flat
🕓 Last Signal Info: Timestamp, price, and strength context
The dashboard helps users learn how volume, slope, and structure interact dynamically during different market phases.
💡 Educational Use Cases
This tool is ideal for traders who want to:
Study momentum evolution through moving averages
Understand EMA slope and compression behavior
Observe how volume validates or contradicts trend strength
Build structured, observation-based learning habits
Develop discipline in recognizing trend exhaustion zones
It is meant as a visual study framework, not as a trading signal generator.
⚙️ Customization Options
Toggle crossover triangles and labels
Optional exit markers (auto-hide after signal)
Show or hide trend background shading
Customizable color settings for each phase
Enable or disable dashboard view
📆 Best Practice for Use
1️⃣ Apply to liquid assets or major indices for reliable band behavior.
2️⃣ Use primarily on 5-min to 1-hour charts to study intraday transitions clearly.
3️⃣ Optionally view on the Daily TF to understand higher-structure slope alignment and long-term trend health.
4️⃣ Observe how slope, band color, and volume interact during trend acceleration and contraction.
5️⃣ Treat dashboard readings as educational context, not trading triggers.
6️⃣ Combine with price structure, volume profile, or demand–supply zones for deeper observation.
⚠️ Important Notes
✅ Designed purely for learning and educational exploration
✅ No trading automation or signal generation included
✅ Does not provide entries, exits, or investment advice
✅ Built to promote structured observation and discipline in analysis
❌ Avoid using on higher timeframes for rapid setups — bands adjust slower there
📐 Glossary
EMA – Exponential Moving Average
HLC – High, Low, Close
Slope – Directional gradient of the mid-band
Volume Ratio – Current volume ÷ 20-bar average
Crossover – Fast EMA crossing Slow EMA
STWP – Simple Trade With Patience
💬 Philosophy Behind the Tool
Developed under the STWP methodology — Simple Trade With Patience — this indicator encourages traders to focus on learning the rhythm of the market, not chasing trades.
Every color, label, and slope change is designed to help users see what price action is communicating rather than predict outcomes.
⚠️ Disclaimer
This indicator is created solely for educational and informational purposes.
It does not constitute financial advice, a trading signal, or an investment recommendation.
Trading involves significant risk and may not be suitable for all participants.
Always consult a SEBI-registered financial advisor or licensed professional before making trading or investment decisions.
The author is not liable for financial loss resulting from the use or interpretation of this script.
By using this tool, you acknowledge and accept these terms.
🤝 Final Note
Built with precision and patience by simpletradewithpatience (STWP) — for traders who value structured learning and objective analysis.
Observe deeply. Learn continuously. Trade with discipline.
📈 Trade Less. Learn More. Let Patience Work for You.
🔒 Script Protection Note
This script is published under Protected visibility to maintain data integrity and prevent unauthorized modification.
The logic remains fully usable for all users while keeping the internal code structure secure — ensuring a safe, stable, and educational experience for everyone.

Quantura - Supply & Demand Zone DetectionIntroduction
“Quantura – Supply & Demand Zone Detection” is an advanced indicator designed to automatically detect and visualize institutional supply and demand zones, as well as breaker blocks, directly on the chart. The tool helps traders identify key areas of market imbalance and potential reversal or continuation zones, based on price structure, volume, and ATR dynamics.
Originality & Value
This indicator provides a unique and adaptive method of zone detection that goes beyond simple pivot or candle-based logic. It merges multiple layers of confirmation—volume sensitivity, ATR filters, and swing structure—while dynamically tracking how zones evolve as the market progresses. Unlike traditional supply and demand indicators, this script also detects and plots Breaker Zones when previous imbalances are violated, giving traders an extra layer of market context.
The key values of this tool include:
Automated detection of high-probability supply and demand zones.
Integration of both volume and ATR filters for precision and adaptability.
Dynamic zone merging and updating based on price evolution.
Identification of breaker blocks (invalidated zones) to visualize market structure shifts.
Optional bullish and bearish trade signals when zones are retested.
Clear, visually optimized plotting for efficient chart interpretation.
Functionality & Core Logic
The indicator continuously scans recent price data for swing highs/lows and combines them with optional volume and ATR conditions to validate potential zones.
Demand Zones are formed when price action indicates accumulation or a strong bullish rejection from a low area.
Supply Zones are created when distribution or strong bearish rejection occurs near local highs.
Breaker Blocks appear when existing zones are invalidated by price, helping traders visualize potential market structure shifts.
Bullish and bearish signals appear when price re-enters an active zone or breaks through a breaker block.
Parameters & Customization
Demand Zones / Supply Zones: Enable or disable each individually.
Breaker Zones: Activate breaker block detection for invalidated zones.
Volume Filter: Optional filter to only confirm zones when volume exceeds its long-term average by a user-defined multiplier.
ATR Filter: Optional filter for volatility confirmation, ensuring zones form under strong momentum conditions.
Swing Length: Controls the number of bars used to detect structural pivots.
Sensitivity Controls: Adjustable ATR and volume multipliers to fine-tune detection responsiveness.
Signals: Toggle for on-chart bullish (▲) and bearish (▼) signal plotting when price interacts with zones.
Color Customization: User-defined bullish and bearish colors for both standard and breaker zones.
Core Calculations
Zones are detected using pivot highs and lows with a defined lookback and lookahead period.
Additional filters apply if ATR and volume are enabled, requiring conditions like “ATR > average * multiplier” and “Volume > average * multiplier.”
Detected zones are merged if overlapping, keeping the chart clean and logical.
When price breaks through a zone, the original box is closed, and a new breaker zone is plotted automatically.
Bullish and bearish markers appear when zones are retested from the opposite side.
Visualization & Display
Demand zones are shaded in semi-transparent bullish color (default: blue).
Supply zones are shaded in semi-transparent bearish color (default: red).
Breaker zones appear when previous imbalances are broken, helping to spot structural shifts.
Optional arrows (▲ / ▼) indicate potential buy or sell reactions on zone interaction.
Use Cases
Identify institutional areas of accumulation (demand) or distribution (supply).
Detect potential breakout traps and market structure shifts using breaker zones.
Combine with other tools such as volume profile, EMA, or liquidity indicators for deeper confirmation.
Observe retests and reactions of zones to anticipate possible reversals or continuations.
Apply multi-timeframe analysis to align higher timeframe zones with lower timeframe entries.
Limitations & Recommendations
The indicator does not predict future price movement; it highlights structural imbalances only.
Performance depends on chosen swing length and sensitivity—users should optimize parameters for each market.
Works best in volatile markets where supply and demand imbalances are clearly expressed.
Should be used as part of a broader trading framework, not as a standalone signal generator.
Markets & Timeframes
The “Quantura – Supply & Demand Zone Detection” indicator is suitable for all asset classes including cryptocurrencies, Forex, indices, commodities, and equities. It performs reliably across multiple timeframes, from intraday scalping to higher timeframe swing analysis.
Author & Access
Developed 100% by Quantura. Published as a Open-source script indicator. Access is free.
Important
This description complies with TradingView’s Script Publishing and House Rules. It clearly explains the indicator’s originality, underlying logic, functionality, and intended use without unrealistic claims or performance guarantees.

Quantura - Average Intraday Candle VolumeIntroduction
“Quantura – Average Intraday Candle Volume” is a quantitative visualization tool that calculates and displays the average traded volume for each intraday time position based on a user-defined historical lookback period. It allows traders to analyze recurring intraday volume patterns, identify high-activity sessions, and detect liquidity shifts throughout the trading day.
Originality & Value
This indicator goes beyond standard volume averages by normalizing and aligning volume data according to the time of day. Instead of simply smoothing recent bars, it builds an intraday volume profile based on historical daily averages, enabling users to understand when during the day volume typically peaks or drops.
Its originality and usefulness come from:
Converting standard volume data into time-aligned intraday averages.
Visualization of historical intraday liquidity behavior, not just total daily volume.
Dynamic scaling using normalization and transparency to emphasize active and quiet periods.
Optional day-separator lines for precise intraday structure recognition.
Gradient-based coloring for better visual interpretation of volume intensity.
Functionality & Core Logic
The indicator divides each day into discrete intraday time positions (based on chart timeframe).
For each position, it stores and updates historical volume values across the selected number of days.
It calculates an average volume per time position by aggregating all stored values and dividing them by the number of valid days.
The result is plotted as a continuous histogram showing typical intraday volume distribution.
The bar colors and transparency dynamically reflect the relative intensity of volume at each point in the day.
Parameters & Customization
Number of Days for Averaging: Defines how many past days are included in the volume average calculation (default: 365).
UTC Offset: Allows synchronization of intraday cycles with local or exchange time zones.
Base Color: Sets the main color for plotted volume columns.
Color Mode: Choose between “Gradient” (transparency dynamically adjusts by intensity) or “Normal” (fixed opacity).
Day Line: Toggles dashed vertical lines marking the start of each trading day.
Visualization & Display
Volume is plotted as a series of histogram bars, each representing the average volume for a specific intraday time position.
A gradient color mode enhances readability by fading lower-intensity areas and highlighting high-volume regions.
Optional day-separator lines visually segment historical sessions for easy reference.
Works seamlessly across all chart timeframes that divide the 24-hour day into regular bar intervals.
Use Cases
Identify when trading activity typically peaks (e.g., session opens, news windows, or overlapping markets).
Compare current intraday volume to historical averages for early anomaly detection.
Enhance algorithmic or discretionary strategies that depend on volume-timing alignment.
Combine with volatility or price structure indicators to confirm market activity zones.
Evaluate session consistency across different time zones using the UTC offset parameter.
Limitations & Recommendations
The indicator requires intraday data (below 1D resolution) to function properly.
Volume behavior may vary across brokers and assets; adjust averaging period accordingly.
Does not predict price movement — it provides volume-based context for analysis.
Works best when combined with structure or momentum-based indicators.
Markets & Timeframes
Compatible with all intraday markets — including crypto, Forex, equities, and futures — and all intraday timeframes (from 1 minute to 4 hours). It is particularly valuable for analyzing assets with continuous 24-hour trading activity.
Author & Access
Developed 100% by Quantura. Published as a Open-source script indicator. Access is free.
Important
This description complies with TradingView’s Script Publishing and House Rules. It provides a clear explanation of the indicator’s originality, logic, and purpose, without any unrealistic performance or predictive claims.

Short-Timeframe Volume Spike DetectorShort-Timeframe Volume Spike Detector
Description:
The Short-Timeframe Volume Spike Detector is an advanced multi-timeframe (MTF) indicator that automatically detects sudden volume surges and price expansion events on a lower timeframe and displays them on a higher (base) timeframe chart — helping traders identify hidden intraday accumulation or breakout pressure within broader candles.
⚙️ How It Works
Select a Base Timeframe (e.g., Daily, 4H, 1H).
The script automatically fetches data from a Lower Timeframe (e.g., Daily → 1H, 1H → 15m).
Within each base bar, it scans all the lower timeframe candles to find:
Volume Spikes: Volume exceeds average × multiplier or a custom threshold.
Price Strength: Candle shows upward movement beyond a minimum % change.
When both conditions are met, a spike signal is plotted on the higher timeframe chart.
🔍 Features
✅ Automatic Lower Timeframe Mapping — Dynamically selects the most relevant lower timeframe.
✅ Two Detection Modes:
Multiplier Mode: Volume spikes defined as multiple of average lower timeframe volume.
Manual Mode: Custom absolute volume threshold.
✅ Trend Filter Option: Show only signals during uptrends (configurable).
✅ Visual Markers:
Purple “X” = Volume Spike Detected
Dotted red & green lines = Candle range extension
✅ Custom Label Placement: Above High / Below Low / At Spike Price
✅ Debug Mode: Displays full diagnostic info including detected volume, threshold, and % change.
📊 Use Cases
Detect early accumulation in daily candles using hourly or 15-min data.
Identify institutional buying interest before visible breakouts.
Confirm strong continuation patterns after price compression.
Spot hidden intraday activity on swing or positional charts.
🧩 Inputs Overview
Input Description
Base Timeframe Main chart timeframe for analysis
Lookback Bars Number of recent candles to scan
Volume Mode “Multiplier” or “Manual Benchmark”
Volume Multiplier Multiplier applied to average lower timeframe volume
Manual Volume Threshold Fixed volume benchmark
Min Price Change % Minimum lower timeframe candle % move to qualify
Use Trend Filter Only show in uptrend (close > close )
Extend Bars Number of bars to extend dotted lines
Label Position Choose Above High / Below Low / At Spike Price
Debug Mode Show live internal values for calibration
🧠 Tips
Ideal for swing traders and multi-timeframe analysts.
Works best when base = Daily and lower = Hourly or 15m.
Combine with Volume Profile, VWAP, or RRG-style analysis for stronger confluence.
Use Multiplier 1.5–2.5 to fine-tune for your asset’s volatility.
⚠️ Notes
Works only when applied to the base timeframe selected in inputs.
May not display signals on non-standard intraday timeframes (like 3H).
Labels limited to max_labels_count for performance stability.

Candlestick Absorption (Pure Price+Volume)📘 Candlestick Absorption (Pure Price + Volume)
An original approach to detecting hidden institutional absorption using nothing but candle structure and relative volume.
🧠 Concept
Every candle tells a story — not just in its color, but in the battle between aggressive orders and passive liquidity.
This indicator isolates those moments where one side of the market absorbs the other’s aggression — when a candle shows excess wicks on high volume but fails to extend in that direction.
Unlike traditional volume indicators or oscillators, this script focuses solely on the interaction between wick length, body size, and relative volume , giving a pure price–volume perspective of absorption and exhaustion.
⚙️ How It Works
1. Relative Volume Detection
• Compares each candle’s volume to a configurable moving average (default SMA 20).
• Marks only candles with significantly above-average activity (e.g. 1.5× SMA) as eligible for absorption.
2. Wick–Body Anatomy Analysis
• Measures the proportion of each candle’s wicks and body within its total range.
• Focuses on long wicks with small bodies , representing strong push-and-absorb behavior.
• The close must remain off the extreme by a user-defined percentage to confirm that the move was rejected.
3. Absorption Logic
• Bullish Absorption (⬆) → long lower wick, high volume, small body, close away from the low → demand absorbed selling pressure.
• Bearish Absorption (⬇) → long upper wick, high volume, small body, close away from the high → supply absorbed buying pressure.
4. Cooldown & Clarity
• A built-in cooldown prevents repetitive signals in congestion zones.
• Optional translucent absorption zones (boxes) extend forward, helping you visualize where future retests may react.
🎯 How to Use It
• Watch for Absorb ⬆ or Absorb ⬇ markers near swing highs/lows, session extremes, or fair-value gaps — these often highlight zones of institutional absorption or stop-runs.
• Combine with market structure or order-flow context rather than standalone entries.
• Use zones as potential re-entry or rejection levels when price revisits them.
• For intraday use, increase High-Volume Factor to 1.8–2.2 to filter noise.
• For higher timeframes, relax wick/body thresholds slightly to capture broader absorption events.
⸻
🔍 What Makes It Original
• Pure Price + Volume logic — no MAs, RSI, VWAP, or momentum filters.
• Uses dynamic wick-to-range ratios and relative-volume qualification instead of arbitrary thresholds.
• Adaptive visual design: the plotted boxes fade as they age, making absorption footprints visually intuitive.
• Works across any market (stocks, crypto, indices, futures) and timeframe without recalibration.
• Zero repainting. All signals are based on completed bars only.
🧩 Inputs Summary
Volume Filter : Volume SMA Length, High-Volume Factor
Defines how much higher a candle’s volume must be compared to its average
Candle Anatomy : Min Wick % of Range, Max Body % of Range, Close Off Edge %
Controls candle geometry for valid absorption
Signal Logic [/b : Cooldown Bars, color filters
Reduces clutter and false clustering
Zones : Draw Zones, Zone Forward Bars, Opacity Levels
Paints temporary liquidity footprints
Visuals : Background Tint
Highlights active absorption bars
⚠️ Important Notes
• Absorption ≠ instant reversal — it’s often a precursor to exhaustion or liquidity shift.
• Always confirm with structure, trend context, or additional confluence.
• Use at your own discretion; the script makes no performance claims.
💡 Suggested Use Cases
• Identifying trap candles at swing highs/lows.
• Spotting hidden institutional participation before reversals.
• Filtering false breakouts in tight ranges.
• Defining retest zones for Smart-Money or volume-profile strategies.

Demand/Supply Oscillator_immyDemand/Supply Oscillator, probably the only D/S oscillator on TV which doesn't draw the lines on the chart but to show you the actual reasons behind the price moves.
Concept Overview
A demand/supply oscillator would aim to look for the hidden spots/order which institutes place in small quantities to not to upset the trend and suddenly place one big order to liquidate the retailers and make a final big move.
The lite color candles in histogram shows the hidden demand/supply which is the reason behind the sudden price pullback, even for short period of time.
Measure demand and supply based on volume, price movement, or candle structure
Identify price waves or impulses (e.g., using fractals, zigzag, or swing high/low logic)
Detect hidden demand/supply (e.g., low volume pullbacks or absorption zones)
Plotted on histogram boxes to visualize strength and direction of each wave
What “Hidden Demand” Means?
Hidden demand refers to buying pressure that isn’t immediately obvious from price action — in other words, buyers are active “behind the scenes” even though the price doesn’t yet show strong upward movement.
What Hidden supply Means?
refers to selling pressure that isn’t obvious yet on the price chart. It means smart money (big players) are quietly selling or distributing positions, even though the price might not be dropping sharply yet.
It usually appears when:
The price is pulling back slightly (down candle),
But volume or an oscillator (like RSI, MACD, or OBV) shows bullish strength (e.g., higher low or positive divergence).
That suggests smart money is accumulating (buying quietly) while the public may think it’s just a normal dip.
💹 Price Reaction — Up or Down?
If there is hidden demand, it’s generally a bullish signal → meaning price is likely to go up afterward.
However, on that exact candle, the price may still be down or neutral, because:
Hidden demand is “hidden” — buyers are absorbing supply quietly.
The move up usually comes after the hidden demand signal, not necessarily on the same candle.
📊 Example
Suppose:
Price makes a slightly lower low,
But RSI makes a higher low → this is bullish (hidden) divergence, or “hidden demand.”
➡️ Interpretation:
Smart buyers are stepping in → next few candles likely move up.
The current candle might still be red or show a small body — that’s okay. The key is the shift in underlying strength.
🧭 Quick Summary
Term Meaning Candle Effect Expected Move After
Hidden Demand Buyers active below surface Candle may still go down or stay flat
Hidden Supply Sellers active behind the scenes Price likely to rise soon
🛠️ Key Components
Best results with Price/Action e.g. Use swing high/low or zigzag to segment price into waves.
Optionally apply fractal logic for more refined wave detection
Combine with other indicators (e.g., RSI, OBV) for confirmation
Include zone strength metrics (e.g., “Power Number” as seen in some indicators)
Demand/Supply Calculation
Demand: Strong bullish candles, increasing volume, breakout zones
Supply: Strong bearish candles, volume spikes on down moves
Hidden Demand/Supply: Pullbacks with low volume or absorption candles
Histogram Visualization
Use plot() or plotshape() to draw histogram bars
Color-code bars: e.g., green for demand, red for supply, lite colors for hidden zones
Add alerts for wave transitions or hidden zone detection
How It Works
Demand/Supply: Detected when price moves strongly with volume spikes.
Hidden Zones: Detected when price moves but volume is low (potential absorption).
Histogram Values:
+2: Strong Demand
+1: Hidden Demand
-1: Hidden Supply
-2: Strong Supply
0: Neutral
Feature Demand (Visible) Hidden Demand
Visibility Clearly seen on price charts Subtle, often masked in consolidation
Participants Retail + Institutional Primarily Institutional
Price Behavior Sharp rallies from zone Sideways movement, low volatility
Tools to Identify Candlestick patterns, support zones Volume profile, order flow, price clusters
Risk/Reward Moderate (widely known) High (less crowded, early entry potential)